background image

Chapter 5: TOOLS

132

October 2021

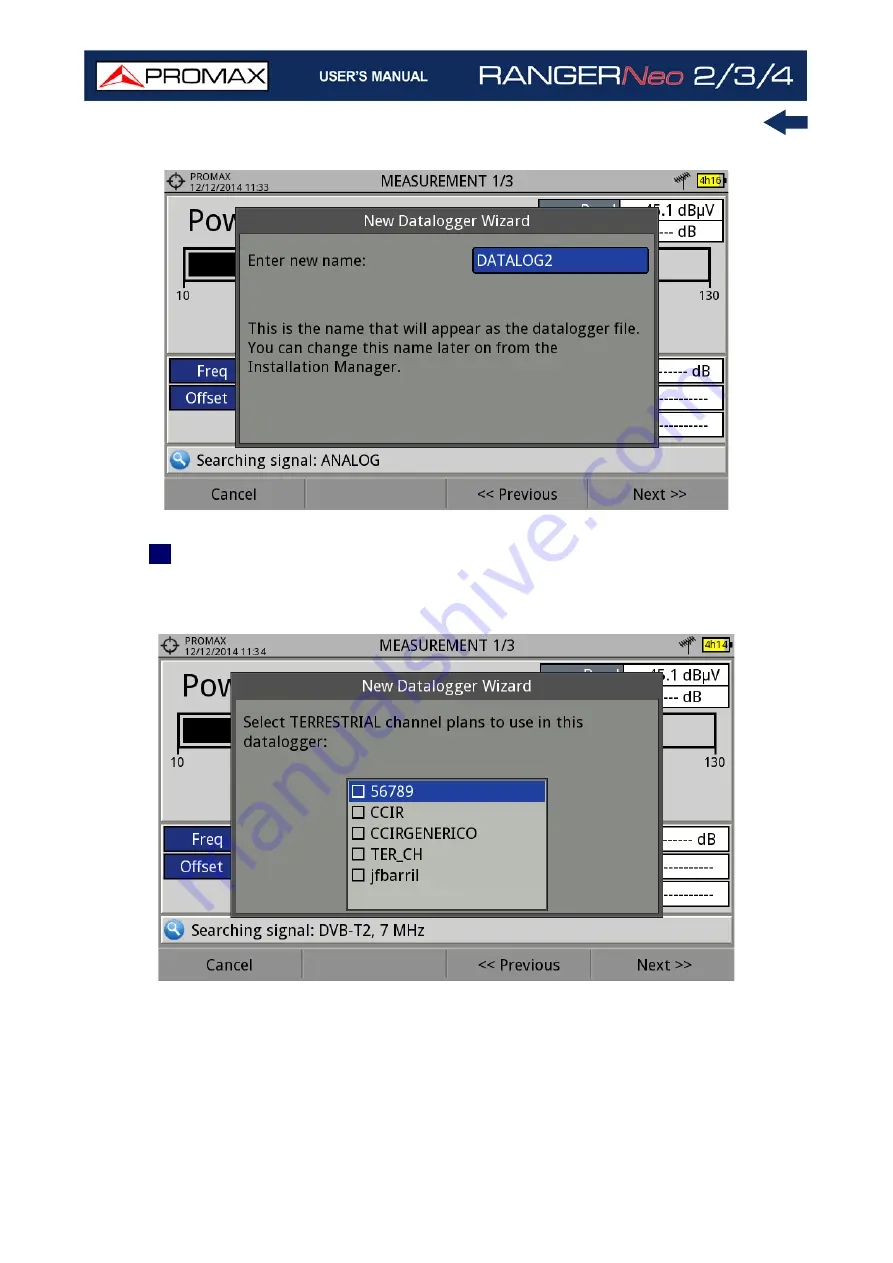
Figure 93. 

 9 

Next, the user can select the terrestrial and/or satellite channel plan to use

in the datalogger. The channel plans that are shown depends on the channel

plans available for the current installation.

Figure 94. 

Summary of Contents for RANGER Neo 2

Page 1: ...RANGER Neo 2 TV AND SATELLITE ANALYZER 0 MI2130 RANGER Neo 3 RANGER Neo 4 ...

Page 2: ...t Index click on page number to access the subject Click on the link or scan the QR code inside de video boxes in order to play a tutorial video USER S MANUAL VERSION Please update your equipment to the latest software version available This user s manual describes operation for models RANGER Neo 2 RANGER Neo 3 and RANGER Neo 4 Differences between them are specified by an asterisk and in certain s...

Page 3: ...parameters in webControl TV Parameters on page 219 New It allows you to stream from TV parameters in webControl TV Parameters on page 219 Improvement webControl can store up to 30 days of data in quality monitoring Signal Quality Monitoring on page 223 New webControl allows you to export and import monitoring Signal Quality Monitoring on page 223 Improvement webControl allows you to reload an unfi...

Page 4: ...ers with these options Datalogger on page 130 Update FM Advanced measurement and DAB Advanced measurement are shown in signal monitoring and signal coverage for meters with these options Signal Monitoring on page 112 New option Power off from menu Switching On Off on page 16 Update Power and MPX deviation from FM Advanced option can be selected as a main measurement for meters with this option ins...

Page 5: ... 232 New tool Service Recording TS from webControl TV Parameters on page 219 New tool Password Recovery from webControl Password Recovery on page 216 Update New icon when the meter is connected to the webControl Settings and Remote Access on page 214 New setting 22 kHz Tone Position Measurement Options on page 51 New preference SMTP e mail server settings SMTP Options on page 55 New option Advance...

Page 6: ...New preference Offset for power level Measurement Options on page 51 New setting Touch panel calibration Appearance Options on page 50 New preference SNMP protocol settings SNMP Options on page 54 Updated It allows disable LNB when short circuit LNB Drain available for terrestrial and satellite band on page 46 Updated Notification when problem during TS recording Updated It allows recording a TS f...

Page 7: ...ement WiFi chapter WIFI MONITORING on page 181 Improvement IPTV chapter IPTV on page 189 New chapter OTT signal OTT on page 202 New chapter webControl tool WEBCONTROL on page 213 Improvement Ethernet Port Ethernet Port on page 250 Specifications unified for all models SPECIFICATIONS RANGER Neo 2 3 4 on page 264 Improvement Additional Information Annex ADDITIONAL INFORMATION on page 326 Improvement...

Page 8: ...ion and Pollution Degree 1 environments When using some of the following accessories use only the specified ones to ensure safety Rechargeable battery External DC charger Car lighter charger cable Power cord Observe all specified ratings both of supply and measurement Remember that voltages higher than 70 V DC or 33 V AC rms are dangerous Use this instrument under the specified environmental condi...

Page 9: ...ated from the mains Cat II Portable domestic installations Cat III Fixed domestic installations Cat IV Industrial installations CAUTION The battery used can present danger of fire or chemical burn if it is severely mistreat Do not disassembly cremate or heat the battery above 100 C under no circumstances ...

Page 10: ...5 Screen Description 68 4 6 Additional Functions 83 5 TOOLS 93 5 1 Introduction 93 5 2 Constellation 94 5 3 LTE Ingress Test 97 5 4 Echoes 100 5 5 MER by Carrier 102 5 6 MEROGRAM 104 5 7 Spectrogram 107 5 8 Attenuation Test 109 5 9 Signal Monitoring 112 5 10 Signal Coverage 120 5 11 Datalogger 130 5 12 Screen and Data Capture Export key 139 5 13 Explore Channel Plan 140 5 14 Discover FM Stations 1...

Page 11: ...ettings and Remote Access 214 10 3 Icon Table 217 10 4 Measurements and Spectrum 218 10 5 TV Parameters 219 10 6 Remote Console 221 10 7 Signal Quality Monitoring 223 10 8 Historical Monitoring 227 10 9 Installations Management 229 10 10 Task Management 234 10 11 Mask Monitoring 237 10 12 Mask Historical Monitoring 244 11 CONNECTING TO EXTERNAL DEVICES 248 11 1 Introduction 248 11 2 USB Port 248 1...

Page 12: ...g by Mail 279 13 2 Considerations about the Screen 279 13 3 Cleaning Recommendations 279 i OPTICAL OPTION 281 ii ADVANCED DAB DAB OPTION 294 iii ADVANCED FM OPTION 311 iv HIGH FREQUENCY OPTION 320 v RACK OPTION 322 vi ADDITIONAL INFORMATION 326 vii MULTIMEDIA CONTENT 327 viii INDEX 331 ...

Page 13: ... RANGER Neo has been created with the aim to make easy the user experience From its ergonomic design and stylized lines to the reduction of keys and the easy use of its interface everything has been designed so the user has a simple tool to use but powerful and useful Figure 1 The RANGER Neo is a universal analyzer that covers several of the most popular standards of the DVB family as well as form...

Page 14: ...on The RANGER Neo 4 in addition to all RANGER Neo 3 functions includes 4K real time video decoding All models can be expanded to work with Fibre Optics or WiFi 5G and LTE 2 6 GHz In an effort to facilitate its work to professionals our long experience ensures an after sales quality service which includes software updates and upgrades for free The RANGER Neo has been designed and developed entirely...

Page 15: ...pter F f DIN f adapter F f F f adapter Support belt and carrying bag 4V RCA Jack Cable USB A USB A cable Monopod Transport suitcase Quick Start Guide The RANGER Neo is powered by a 7 2 V built in rechargeable Li Ion battery of high quality and long operation time 2 1 Package Content only available for RANGER Neo 3 and RANGER Neo 4 NOTE Keep the original packaging since it is specially designed to ...

Page 16: ...ment through the power connector on the side panel see figure Figure 2 Then connect the DC power adapter to the mains via the mains cord Ensure that your mains voltage is compatible with the adapter voltage For a fast charging is necessary to switch off the equipment If the equipment is ON the battery charge will be slower depending on the type of work you are doing When connecting the equipment t...

Page 17: ...he Preferences menu pressing the key for 1 s Power Off It allows the user to select the time to power off which is the time after which the equipment shuts down automatically unless pressing any key TFT Screen User can select a time after which the TFT screen turns off but the equipment is still running normally The equipment can measure for example making a datalogger or channel exploration and t...

Page 18: ...apacity as you go through its life Contact your PROMAX distributor when necessary to replace the battery To extend battery life the user should follow these tips In case of providing a long inactivity period of the equipment it is advisable to make every 3 months a charge discharge cycle and a subsequent partial charge 40 aprox It is advisable to keep it in a cool place and away from heat You shou...

Page 19: ...October 2021 7 Chapter 2 SETTING UP Figure 3 Front View 2 3 Equipment Details Inputs and Outputs S C A N 2 3 1 RANGER Neo 2 ...

Page 20: ...Chapter 2 SETTING UP 8 October 2021 Figure 4 Side View ...

Page 21: ...October 2021 9 Chapter 2 SETTING UP Figure 5 Top View ...

Page 22: ...Chapter 2 SETTING UP 10 October 2021 Figure 6 Front View For Optical Option refer to annex 2 3 2 RANGER Neo 3 ...

Page 23: ...October 2021 11 Chapter 2 SETTING UP Figure 7 Side View ...

Page 24: ...Chapter 2 SETTING UP 12 October 2021 Figure 8 Top View ...

Page 25: ...October 2021 13 Chapter 2 SETTING UP Figure 9 Front View For Optical Option refer to annex 2 3 3 RANGER Neo 4 ...

Page 26: ...Chapter 2 SETTING UP 14 October 2021 Figure 10 Side View ...

Page 27: ...October 2021 15 Chapter 2 SETTING UP Figure 11 Top View ...

Page 28: ... power off or reboot Long Press 2 s The equipment turns off directly Switching Off by software 1 Press the Tools key 2 Select the Power Off option Switching Off by software Energy save 1 Press the Preferences key press 1 s 2 Select the Appearance tab 3 The option Off allows the user to enable the automatic shutdown option Select a waiting time time without pressing any key and the meter not workin...

Page 29: ...ot switch on If it does not start after trying turning on by the normal procedure by pressing the ON OFF button with the meter connected to the mains then RESET When it does not finish the boot process Hold down the ON OFF button for 10 seconds and if the meter does not turn off then RESET On the screen are some icons that provide useful information to the user about the current status of the inst...

Page 30: ...Chapter 2 SETTING UP 18 October 2021 RF Menu Figure 13 RF Tuning 2 7 Menu Tree ...

Page 31: ...October 2021 19 Chapter 2 SETTING UP Figure 14 Tools Menu ...

Page 32: ...Chapter 2 SETTING UP 20 October 2021 Figure 15 Advanced Menu ...

Page 33: ...October 2021 21 Chapter 2 SETTING UP WiFi Menu Figure 16 ...

Page 34: ...Chapter 2 SETTING UP 22 October 2021 IPTV Menu Figure 17 Figure 18 ...

Page 35: ...October 2021 23 Chapter 2 SETTING UP Installation Management Menu Figure 19 ...

Page 36: ...Chapter 2 SETTING UP 24 October 2021 Preferences Menu Figure 20 ...

Page 37: ...October 2021 25 Chapter 2 SETTING UP Settings Menu Figure 21 Figure 22 ...

Page 38: ...ess keys shortcut keys The menu navigation includes hints that appear when the cursor is placed on an disabled grayed option for a while These hints help the user to understand why an option is disabled and what to do to enable it The control software is designed in such a way that the meter can be fully operated using the touch panel These actions can be done through the touch panel Menu Selectio...

Page 39: ...ober 2021 27 Chapter 2 SETTING UP Menu Selection User can operate on the menus on screen drop down a menu select an option accept or exit a message and so on just touching on the option Figure 23 Figure 24 ...

Page 40: ...ETTING UP 28 October 2021 Figure 25 Frequency or Channel Selection At the Spectrum Analyzer mode user can select a channel or frequency by tapping on the frequency or channel Figure 26 First screen channel locked ...

Page 41: ...October 2021 29 Chapter 2 SETTING UP Figure 27 Tap on the new frequency Figure 28 The cursor moves to the frequency ...

Page 42: ...ter 2 SETTING UP 30 October 2021 Frequency or Channel Scroll At the Spectrum Analyzer mode user can scroll through frequency or channels by dragging and dropping his finger on the screen Figure 29 Figure 30 ...

Page 43: ...October 2021 31 Chapter 2 SETTING UP Virtual keyboard keypad writing User can type directly on the on screen keyboard or keypad Figure 31 Figure 32 ...

Page 44: ...bar Access User can access the most important functions through the toolbar by pressing on the right top corner of the screen It displays a box with several icons to access several functions Figure 33 Figure 34 Toolbar Icons Description Icons ...

Page 45: ...UP Mode Screens User can switch the view of the current mode by pressing on the top center of the screen Figure 35 Installations Management User can access data from the current installation by pressing on the left top corner Figure 36 ...

Page 46: ...TTING UP 34 October 2021 One Touch Zoom in In a view with different windows Measurement Spectrum and or TV if the user clicks on one of the windows he will directly access the corresponding enlarged view Figure 37 ...

Page 47: ...the joystick is multifunctional that is each time you press on it validate its function changes Figure 39 Functions of Joystick in SPECTRUM ANALYZER mode The user can see the active function according to the icon that is displayed at the upper right corner of the equipment see next figure 2 8 2 Joystick ...

Page 48: ...ystick has these functions Left Right Channel change or frequency change according to tune selected tune by channel or tune by frequency Up Down Change of TV service In SPECTRUM ANALYZER mode the joystick has these functions Left Right CH or FR Channel change CH or frequency FR change according to tune selected tune by channel or tune by frequency SP Span change MK Marker move if marker is enabled...

Page 49: ...hese functions Left Right CH or FR Channel CH change or frequency FR change according to the tune selected tune by channel or tune by frequency EC Echo change Up Down Distance span To edit or select any parameters follow these instructions 1 Place over the option and press the joystick 2 The data field gets into the edit mode yellow background 3 A menu is deployed with some options or if it is num...

Page 50: ... Screenshot Reference key Depending on how long you press this key it has two different functions Short Press 1s Pressing this key for less than one second on the Spectrum Analyzer mode it holds on screen the current waveform as a trace or reference It is equivalent to go to the option Reference Set from the Advanced menu Pressing short again it deletes the waveform reference It is equivalent to g...

Page 51: ...only the first view of each function is available Each view name is shown at the top centre of the screen When reaching the third view it returns to the first view There are four programmable keys also called softkeys numbered from to Each key provides access to one menu This menu changes according to the mode or tool selected The menu is displayed over each softkey at the bottom of the screen Fig...

Page 52: ...oystick on the key To block upper case press or press the joystick on the key twice To return to lower case press or the key again Keys with a point at top right corner give access to special characters by keeping pressed the joystick for one second on the key The next section is a general explanation of how to tune a terrestrial or satellite RF signal step by step For more details about operation...

Page 53: ...ea in option Channel plan 11 In case you do not find a proper channel plan you can add or create a new channel plan using one of this tools Press Manage F3 Installation Add Channel Plan F3 Tools Explore Channel Plan WebControl Installations management Create a Channel Plan 12 Press and confirm StealthID is enabled On 13 Search your frequency or channel by moving the cursor left or right You can al...

Page 54: ...equency press the Settings key and select the settings parameters Supply voltage polarization and satellite band 12 If you select the tune by channel option then select in Channel plan a proper channel plan according to your area Channels from channel plan have pre set parameters supply voltage polarization and satellite band so they cannot be changed from the Settings menu 13 In case you do not f...

Page 55: ...ETTINGS AND PREFERENCES Press the Settings key to access the settings menu Depending on the signal source the menu may be different Figure 44 Settings for RF Terrestrial and Satellite band Figure 45 Settings for WiFi and IPTV Video Audio 3 1 Settings Menu ...

Page 56: ...cording tool RF Demodulators This option is available only if RF is selected as a Signal Source The TS extracted from the RF signal by means of the internal RF demodulator The RF signal can come from digital terrestrial satellite or cable IPTV This option is available only if IPTV is selected as a Signal Source The TS extracted from the IPTV signal ASI Input The TS coming directly through the ASI ...

Page 57: ...rrestrial and satellite band It enables or disables the power supplied to external units such as preamplifiers for antennas in terrestrial television or LNBs and FI simulators in the case of satellite TV When this option is enabled the equipment applies at the output the voltage selected by the user in the Supply Voltage option see below When this option is disabled the equipment does not apply th...

Page 58: ...ite Equipment Control is a communication protocol between the satellite receiver and accessories of the satellite system for more details refer to CONNECTING TO EXTERNAL DEVICES on page 248 SCD EN50494 only available for satellite band It enables or disables the SCD EN50494 function to control devices of a satellite TV installation that supports this technology for more details refer to CONNECTING...

Page 59: ...are not properly selected a warning is issued LNB High Osc only available for satellite band It defines the local oscillator frequency for the LNB high band up to 25 GHz When a channel plan is selected but LNB oscillator values are not properly selected a warning is issued Press the Settings key for one second to access the Video Audio settings menu Figure 46 A brief explanation of each option ava...

Page 60: ...ting continent and country city Measurements It allows the user to choose between several units of measure among other parameters Tools It allows to edit some parameters for different tools StealthID It allows the user to select the set of signal types being used while auto identifying any modulation type Security It allows to edit the PIN code IPTV IPTV network parameters settings Network Network...

Page 61: ... 3 SETTINGS AND PREFERENCES Figure 47 To navigate between tabs move the joystick left or right To navigate between options inside the tab move the joystick up or down Press Exit to exit Preferences Press Save to save changes ...

Page 62: ...ssages and screens Available languages are English Spanish Catalan Czech German French Italian Norwegian Polish Portuguese Greek Russian Slovak and Swedish Once the new language is selected the equipment shows a warning message and re starts in order to load the new language Skin It is the theme and colours used on screen Power Off It allows the user to select the time to power off which is the ti...

Page 63: ...ght Saving Time Measurement Options Terrestrial Units It allows the user to select the terrestrial measurement units for the signal level Available options are dBm dBmV and dBµV Satellite Units It allows the user to select the satellite measurement units for the signal level Available options are dBm dBmV and dBµV Optical Units It allows the user to select the optical measurement units for the sig...

Page 64: ...se for services in terrestrial band and another for services in satellite band Services are included automatically when the signal is locked If enabled these services will be displayed on the View all services option in the Tuning menu Export Button It allows the user to select the data to be exported when pressing the export key among the following options screen only data only or both More info ...

Page 65: ... register the equipment into a data network This is necessary to receive IPTV signal Network parameters are MAC Physical address of the equipment It is unique and cannot be edited DHCP Enable this option to get the proper IP address when the unit is first connected to a network That feature contributes to make things easier to installers when debugging network access Enable the DHCP protocol for p...

Page 66: ...hen debugging network access IP Address IP Address of the equipment into the local network Mask Subnet mask of the equipment by default 255 255 255 0 Gateway IP Address of the router into the local network by default 10 0 1 1 Streaming V A Options Streaming parameters that user has to fill out in order to broadcast video audio from the meter to a PC Streaming parameters are IP Address IP address b...

Page 67: ... Server port From e mail address Connection type secure unsecure Authentication required Check this box if authentication is required and in that case enter user and password NTP Options NTP Network Time Protocol is a network protocol that synchronizes time from a server on a device It periodically connects this server and updates date and time This function requires an Internet connection to work...

Page 68: ... several RF modes demodulated spectrum measures which is very convenient to identify problems The StealthID function is an auto identification system which identifies type and characteristic parameters of the signal and then tries to tune and demodulate it with no need to enter any parameter by hand 1 Connect the RF input signal to the equipment 2 Press the Settings key to access Settings menu and...

Page 69: ... transmission standard and gives access to the signal parameters menu It displays the Tools menu It displays the Advanced menu In general these options are the same for all modes Measure Spectrum Analyzer and TV The specific options for a mode are placed in the menu Advanced pressing the key In next sections each one of these menus is described Press to access It contains tuning options Tuning opt...

Page 70: ...cted channel and it will appear on the option Channels can be changed directly with the joystick in CH mode In case of tuning by frequency 1 Place over the Frequency option and press the joystick 2 The option is highlighted in yellow to indicate it is in edit mode 3 Move the joystick left right to move between the figures and up down to change the figure NOTE When using tune by channel on satellit...

Page 71: ...he joystick up or down Span This option is available only for the Spectrum Analyzer mode It allows to edit the span which is the frequency range displayed on screen on the horizontal axis The current span value appears on screen at bottom right Span available values change according to Resolution Bandwidth selected see Spectrum Analyzer Mode on page 271 To switch among span default values move the...

Page 72: ...current installation The list shows service name provider SID stream identifier and an icon that shows its type radio TV and if it is scrambled When hovering on the service for one second it displays a hint window with more information If user presses the joystick on a service it will access that service When disabling the Database services option all services in the installation will be deleted f...

Page 73: ...se parameters are detected The remaining transmission parameters are detected demodulating the locked signal In case of a DVB S S2 signal the symbol rate parameter can be set manually In case of a Generic signal the bandwidth of the channel can be set manually In case of a DVB S2 signal there will be some special settings for this type of signal They are Physical Layer Scrambling or PLS is used in...

Page 74: ...hem are selected Press the key to save the changes made and the key to exit the Preferences screen Operation 1 Press the key and check the StealthID option is ON 2 Press the Settings key 3 Select the band terrestrial or satellite 4 Select a channel or frequency to identify 5 The bottom of the screen shows the message Searching for signal and the standard transmission checking The identification sy...

Page 75: ...sion exclusive for DirecTV DSS Digital Cable Television First Generation DVB C Digital Cable Television Second Generation DVB C2 Integrated Services Digital Broadcasting Terrestrial ISDB T Digital multi programme systems for television sound and data services for cable distribution J83 Annex B Analogue TV Analogue FM DAB Digital Audio Broadcasting Access by the key It shows the Tools menu If a spe...

Page 76: ...f signal interferences coming from mobile phones Attenuation Test This feature allows the user to easily check the response of the telecommunications installations before antennas and headers are working Echoes It detects the echoes that may appear due to the simultaneous reception of the same signal from several transmitters MER by carrier This function analyses continuosly the measure of the MER...

Page 77: ...eginning to the final destiny Power Off This option allows you to switch off the meter from the menu For more information about these features refer to TOOLS on page 93 Press key to access advanced options for the mode selected Advanced Menu in Spectrum Analyzer Mode Average The user can select the amount of signal values to be used to set the average signal value to be displayed on screen The lar...

Page 78: ...cting sporadic noises Min Hold Off Permanent Curtain It allows the user to display the current signal with the minimum values measured for each frequency The OFF option disables this function The Curtain option displays the minimum values in green for a moment with the current signal The Permanent option maintains minimum signal on the screen This option is useful for detecting interferences in TV...

Page 79: ...signal between antenna via RF connector and external via V A input connector To get an external analogue signal use the A V input Aspect Ratio This option is available only if the detected or selected signal is ANALOGUE It allows the user to select the image aspect ratio 4 3 16 9 It remembers this selection even after switch off Advanced This option is available only if the detected or selected si...

Page 80: ...rum mode and TV mode is described below To change the mode press the corresponding mode key To change the screen in the same mode press the same mode key consecutively 4 5 Screen Description Spectrum Analyzer 1 3 S C A N Spectrum Analyzer 2 3 S C A N Spectrum Analyzer 3 3 S C A N Measurement mode S C A N TV mode S C A N ...

Page 81: ...vel 5 Total power detected over the whole selected band terrestrial or satellite The total power can be used to know when it is close to saturation It also shows the link margin measurement The link margin is the margin of safety remaining for a good reception 6 Graphical measurement of the main measurement 7 Measurement values for the type of locked signal 8 Signal status searching locked multipl...

Page 82: ...tion date and time 2 Image of locked signal 3 Number of view total views 4 Selected band battery level 5 Spectrum of locked signal 6 Measurement values for the type of locked signal 7 Signal status searching locked multiplex name 8 Softkeys menus Joystick functions Joystick left right It changes channel frequency ...

Page 83: ...lation date and time 2 Number of view total views 3 Selected band battery level 4 Demodulation parameters for the locked signal 5 Measurement values for the type of locked signal 6 Signal status searching locked multiplex name 7 Softkeys menus Joystick functions Joystick left right It changes channel frequency ...

Page 84: ...ng the cursor 5 Spectrum in the band with the selected span 6 Centre frequency and cursor It also shows the bandwidth of a digital locked signal 7 Signal status searching locked multiplex name selected span 8 Softkeys menus Joystick functions Joystick up down It changes reference level Joystick left right depending on the joystick active mode SP Span change FR or CH Frequency change or Channel cha...

Page 85: ...ointing the cursor 5 Image of the tuned signal 6 Spectrum in the band with the selected span 7 Centre frequency and cursor It also shows the bandwidth of the digital signal locked 8 Signal status searching locked multiplex name selected span 9 Softkeys menus Joystick functions Joystick up down It changes reference level Joystick left right depending on the joystick active mode SP Span change FR or...

Page 86: ...nd battery level 4 Spectrum in the band with the selected span 5 Centre frequency and cursor It also shows the bandwidth of a digital signal locked 6 Softkeys menus Joystick functions Joystick up down It changes reference level Joystick left right depending on the joystick active mode SP Span change FR or CH Frequency change or Channel change MK Marker change if marker is enabled ...

Page 87: ...an option in the Tuning menu key 5 Reference Level It is the power range represented on the vertical axis To change use the joystick up down 5 dB steps This equipment has an option to activate the automatic adjustment of the reference level so it detects the optimal reference level for each situation In automatic mode it sets the optimum reference level each time it enters the spectrum mode This o...

Page 88: ...RKER MK mode The window Marker shows the following data Freq Frequency where is placed the marker MHz units accurate to Hz Level Power level at the frequency where is placed the marker in case of working with FSM tool it shows FSM level ΔF Difference of frequency between the marker and the main cursor MHz units accurate to Hz ΔL Difference of power level between the marker and the main cursor 8 Ce...

Page 89: ...iew total views 3 Selected band battery level 4 Tuned service image 5 Signal status searching locked multiplex name and name of the selected service 6 Softkeys menus Joystick functions Joystick up down It changes service Joystick left right It changes channel frequency depending on the tuning mode 4 5 3 TV Mode Screens ...

Page 90: ... band battery level 4 Tuned service image 5 Spectrum 6 Measured values of the signal in the frequency channel the cursor is pointing 7 Signal status searching locked multiplex name and name of the selected service 8 Softkeys menus Joystick functions Joystick up down It changes service Joystick left right It changes channel frequency depending on the tuning mode ...

Page 91: ...aspect ratio and frequency PROFILE Profile level PID Video program identifier 4 Number of view total views 5 Selected band battery level 6 Tuned service information NETWORK Television distribution network Terrestrial Orbital position Satellite PROVIDER Program provider name NID Network identifier where the signal is distributed ONID Identifier of the original network where the signal originates TS...

Page 92: ...vice audio format Bit depth sampling frequency sound reproduction LANGUAGE Broadcasting language PID ID of the audio program 8 Signal status searching locked multiplex name and name of the selected service 9 Softkeys menu Joystick functions Joystick up down It changes service Joystick left right It changes channel frequency depending on the tuning mode NOTE For services with video in 4K UHD the RA...

Page 93: ...October 2021 81 Chapter 4 RF SIGNAL TUNING AUDIO RADIO RADIO 1 3 Figure 58 AUDIO RADIO SPECTRUM MEASUREMENT RADIO 2 3 Figure 59 ...

Page 94: ...Program type UTC Time Universal time Local Local time ECC Extended country code LIC Language Identification Code TP Traffic program TA Traffic announcement MS Music switcher 2 Radiotext Extra text information 3 Decoder ID It identifies different operation modes of the decoder 4 Alternative Freqs It shows alternative frequencies and its total number ...

Page 95: ...cording to the bandwidth selected by the user The triple cursor shows on screen the BW selected by the user The spectrum analyzer makes easier the fieldwork for engineers when working with SNG mobile units and VSAT communications since it allows adjusting transmission reception systems It also has several functions to identify satellites that avoid any possibility of error When the signal is locke...

Page 96: ... Beacon screen shots signals with a span of 10 MHz and a bandwidth of 100 kHz resolution all with a sweep time of 90 ms Figure 61 Figure 62 More info about satellite signals in the application note How to point a dish antenna available on the PROMAX website ...

Page 97: ... operators to communicate directly with the RFI source to resolve the incident IRG descriptor function is available only for signals containing the carrier identifier To access this feature 1 Connect the RF input signal to the equipment 2 Tune the channel that produces interferences 3 Access the TV mode and press the Advanced menu 4 Select the TS Data option If the signal has a carrier identifier ...

Page 98: ... DAB receivers are not compatible with DAB receivers There is an option to improve to DAB ADVANCED with better specifications and more tools for more details refer to ADVANCED DAB DAB OPTION on page 294 1 Connect the RF input signal to the equipment 2 Select RF source signal and terrestrial band in Settings menu 3 To enable auto detection for DAB DAB access Preferences pressing the key for one sec...

Page 99: ...October 2021 87 Chapter 4 RF SIGNAL TUNING Figure 64 Measurement 1 3 Figure 65 Measurement 2 3 4 6 4 3 Measurement Mode ...

Page 100: ...Chapter 4 RF SIGNAL TUNING 88 October 2021 Figure 66 Measurement 3 3 Figure 67 DAB Spectrum 1 3 4 6 4 4 Spectrum Analyzer Mode ...

Page 101: ...October 2021 89 Chapter 4 RF SIGNAL TUNING Figure 68 DAB Spectrum 2 3 Figure 69 DAB Spectrum 3 3 ...

Page 102: ...Chapter 4 RF SIGNAL TUNING 90 October 2021 Figure 70 DAB 1 3 Figure 71 DAB 2 3 4 6 4 5 TV Mode ...

Page 103: ...s UHD video frames and displays them on screen as a slideshow RANGER Neo 4 is able to decode 4K UHD services Ultra High Definition and shows its data broadcasting information and video audio The equipment can measure LTE signals at 900 MHz band 8 or at 2600 GHz band 7 1 Connect the RF input signal to the equipment In Settings select the RF source signal and the terrestrial band 4 6 5 4K Decoding D...

Page 104: ...tuning by channel or frequency If you have a channel plan with the operators channels then use the tuning by channel If not then use tuning by frequency 5 If using tuning by frequency enter the frequency for the operator s link you want to measure If using tuning by channel just select a channel Figura 73 6 Set the SPAN to better signal view Measure on downlink and uplink frequencies Contact PROMA...

Page 105: ...Signal Monitoring All signals Signal Coverage All signals GPS connected to USB port is mandatory Datalogger All signals Screen and Data Capture Export key DVB T DVB T2 DVB S DVB S2 DSS DVB C DVB C2 analogue FM generic Also for other source signals IPTV WiFi and OTT Explore Channel Plan All signals Discover FM Stations FM Field Strength All signals Task Planner All signals Also for IPTV source sign...

Page 106: ...h can visually determine the type of problem in the signal Each type of modulation is represented differently A 16 QAM signal is shown on screen by a diagram of a total of 16 different zones and a 64 QAM signal is represented by a diagram of 64 different zones and so on The constellation diagram shows in different colours the density of hits and includes features to zoom move and delete the displa...

Page 107: ...bols to red highest density Greater dispersion of the symbols indicates higher noise level or worse signal quality signal If there is symbols concentration with respect to the full grid see advanced menu for types of grid this is indicative of good ratio signal noise or absence of problems 3 Selected band battery level 4 Constellation modulation 5 Data Window Data shown are Start Carrier Stop Carr...

Page 108: ...lation tool They are Grid type Full Grid The grid where the constellation is displayed is a complete grid Cross Grid The grid where the constellation is displayed is made of crosses Persistence It allows the user to set the level of persistence which is the lapse of time the signal stays on the screen before disappearing Available options according to the persistence level are low medium high or p...

Page 109: ... for the TV channels close to 790 MHz where is the end for the current UHF If we are close to a LTE station with low downlink channels a filter cannot be a sufficient solution Other options to better mitigate the LTE signals can be considered such as a change in the location of the TV antenna or a passive shield in the way between the two antennas TV and LTE For more information refer to applicati...

Page 110: ...nnected or No if filter is not connected 6 It starts to measure 7 To change filter status ON OFF press again the key and will appear a confirmation message Connect disconnect the LTE filter at the RF input and then press key Ok to start measuring 8 The user can enable disable the LTE measure by pressing the ON OFF Remember to connect disconnect the LTE filter to the RF input Each time a LTE measur...

Page 111: ...r frequencies 4 Spectrum band frequencies between minimum and maximum filter frequencies 5 Identifier icon of the LTE filter ON when using internal LTE filter 6 Selected band battery level 7 Time elapsed with filter disabled OFF 8 Measurement with LTE filter disabled MER Maximum and minimum MER for the TV channel tuned the one probably affected by the LTE interference signal LTE Power Maximum and ...

Page 112: ...errestrial channel and therefore it can detect echoes that can occur due to the simultaneous reception of the same signal from several transmitters with different delays and amplitudes Another cause that may cause echoes is reflection of the signal on large objects as buildings or mountains This may be the explanation that having a good C N and a good signal the BER does not reach the minimum valu...

Page 113: ...ital signal at the terrestrial band 3 Press the Tools key 4 Select the Echoes option 5 The Echoes function of the tuned signal appears on screen Screen Description Figure 76 1 Selected installation date and time 2 Selected band battery level 3 Main signal data Frequency Power C N and Cell ID it shows the main signal transmitter if available 4 Echoes Diagram The display shows a graphical representa...

Page 114: ...k to switch between the Echoes EC mode and the Channel Frequency CH FR mode At the bottom of the screen there are four menus available via the function keys It displays the channel frequency where is pointing the cursor it allows the user to select a channel or frequency a channel plan and access the tuning menu It displays the selected transmission standard menu and accesses the signal parameters...

Page 115: ... and DVB C2 1 Connect the RF input signal to the equipment 2 Select terrestrial band and tune a DVB T DVB T2 or DVB C2 digital signal 3 Press the Tools key 4 Select MER by carrier option 5 The MER function appears on screen 6 To exit press any key of mode TV mode Spectrum mode or Measurement mode Screen Description 1 Selected installation date and time 2 Joystick active mode Selected band battery ...

Page 116: ...e via the function keys It displays the channel frequency where is pointing the cursor it allows selecting channel plan and channel and access the tuning menu It displays the selected transmission standard menu and accesses the signal parameters It displays the Tools menu The MEROGRAMA function shows a graphical representation of the MER level for each carrier of the locked signal which is superim...

Page 117: ...ency 3 Press the Tools key 4 Select the MEROGRAM function 5 It shows the MEROGRAM function of the signal 6 To exit press any key of mode TV mode Spectrum mode or Measurement mode All data registered is cleaned after leaving Screen Description Figure 77 1 Selected installation date and time 2 Measurement values for the signal tuned at the frequency channel selected 3 Maximum level of MER 4 MEROGRAM...

Page 118: ...isplays the channel frequency where is pointing the cursor it allows selecting channel plan and channel and access the tuning menu It displays the selected transmission standard menu and accesses the signal parameters It displays the Tools menu It displays the Advanced menu In the Advanced menu there are some options for the MEROGRAM function configuration They are User measure It allows the user ...

Page 119: ...Spectrogram tool is available for all signals 1 Connect the RF input signal to the equipment 2 Select a channel or frequency 3 Select the SPAN within the spectrogram will be displayed 4 Press the Tools key 5 Select the Spectrogram option 6 It shows the Spectrogram of the signal 7 To exit press any key of mode TV mode Spectrum mode or Measurement mode All data registered is cleaned after leaving Wh...

Page 120: ...tery level 6 Maximum and minimum values of signal power and band power over time 7 Maximum and minimum value of the measure selected by the user in the option User measure see next section 8 Elapsed time 9 Signal status searching locked multiplex name selected span Joystick functions No function for this tool Axis description Axis X Span MHz Axis Y Power At the bottom of the screen there are four ...

Page 121: ... Details It allows the user to view on screen the date and time when maximum and minimum measures were reached To quit this view press the key Clear measures It clears the spectrogram measurement and restarts the timer The Attenuation Test function allows the user to easily check the response of the telecommunications installations before antennas and headers are working It allows the user to eval...

Page 122: ...connected to the source point of the distribution system and take measurements in each user access point with the equipment 10 In each measurement a message over each pilot signal indicates whether the measure Pass or Fail according to the parameters set 11 The measurement data from the Attenuation Test can be saved through the Datalogger tool To do this when creating a new datalogger in the optio...

Page 123: ... level of the reference signal obtained when setting the reference and used to calculate the attenuation level dBµV 7 Power level of the test signal at the user access point dBµV 8 Attenuation level dB Attenuation Reference Current 9 Softkeys Joystick functions No function for this tool Axis description Axis X Pilot signals Axis Y Power In the bottom of the screen are four menu accessible via the ...

Page 124: ...on screen if the signal passes or fails When the attenuation level is below this value the message on screen is PASS and when it is above this value is FAIL Pilot 0 It defines the frequency of the pilot signal 0 MHz Pilot 1 It defines the frequency of the pilot signal 1 MHz Pilot 2 It defines the frequency of the pilot signal 2 MHz The Signal Monitoring tool allows monitoring one locked signal or ...

Page 125: ...arting it shows some warnings to confirm signal parameters signal locked or unlocked bandwidth and reference level and if the file name already exists 9 In Continuous mode the equipment takes samples automatically according to sample time see next section In Manual mode each time the user presses the joystick the equipment takes a sample In Schedule mode it starts to take samples automatically at ...

Page 126: ...ingle Channel Monitoring Figure 81 Channel Plan Monitoring 1 Selected installation date and time 2 Spectrum 3 Power measurement over time window size is span time set in configuration 4 MER and C N measurement over time window size is span time set in configuration ...

Page 127: ...eginning of the monitoring Samples Samples taken since the beginning of the monitoring Space left Space left in the memory to save data 10 Channels from the channel plan being monitored Measurement data are from the selected channel pointed by a red arrowhead Joystick functions No function for this tool Axis Description Single channel monitoring screen Axis X Window 1 Frequency Window 2 and 3 Time...

Page 128: ... User can adjust some parameters on the Signal Monitoring Figure 82 Settings for Single Channel Monitoring File Name User can give a name to the file where data is saved All measurement will be stored on the data file Be sure to change the file name when starting a new signal monitoring If not after a warning message the new data file will be saved on the last one Comment User can write some comme...

Page 129: ... in a USB flash drive connected to the port of the equipment GPS Alarm If this box is checked then it sounds a beep when the GPS is unlocked The data viewer allows the user to watch the monitoring final results It accesses directly when signal monitoring ends or also by opening the data file in the installation management screen According to the monitoring signal saved parameters can change For ex...

Page 130: ...of the time span Joystick Press It switches between panoramic PA and movement MA mode Description This document is an explanation about the process that is needed to be done in order to obtain a more comfortable view of the XML data obtained with the meter when performing a Signal Monitoring Once you got the monitoring data copy the XML data file from the equipment to a USB memory using the Instal...

Page 131: ... open the file it will ask you the import method to open the XML data file by this way Figure 85 5 You must choose the option in which a stylesheet is asked It will appear as an option the COVERAGE xsl file you can download the COVERAGE xsl file from the PROMAX website 6 Now Excel is opening the XML data file using the format that the XSL file is providing This step could take few seconds dependin...

Page 132: ...ral channels by measuring power and other parameters over time The position where all these measurements are taken is determined by a GPS receiver When the equipment locks a GPS signal it automatically sets date and time using the GPS signal As long as the GPS is locked date and time is updated every hour All this data measurements and GPS position can be visualized on the meter or downloaded to a...

Page 133: ...al locked or unlocked bandwidth and reference level and if the file name already exists 10 In Continuous mode the equipment takes samples automatically according to sample time see next section In Manual mode each time the user presses the joystick the equipment takes a sample In Schedule mode it starts to take samples automatically at the end of the countdown to the starting time Measurement are ...

Page 134: ...ected installation date and time The Current installation in green indicates the system has locked the GPS signal The Current installation in red indicates that the system has not locked the GPS signal 2 Spectrum 3 Power measurement over time span time is set in configuration 4 MER and C N measurement over time span time is set in configuration ...

Page 135: ...he coverage study Space left Space left in the memory to save data GPS status It shows if the GPS receiver is locked or unlocked Latitude Longitude It shows the latitude and longitude at the current position if GPS is locked 10 Channels from the channel plan being monitored Measurement data are from the selected channel pointed by a red arrowhead Joystick functions No function for this tool Axis D...

Page 136: ...rs for more details refer to next section Audio It allows enable or disable audio When this option is enabled the user can listen to any service in the monitored signal knowing about signal reception while driving or doing other tasks GPS Status It shows a list and a graph with satellites detected to locate the GPS signal It is also provided additional data such as longitude latitude date and univ...

Page 137: ...art in Advanced menu to start the countdown to the starting time Sample Time Time between samples Only when working in continuous or schedule mode Minimum time is 1 second Span time only for signal channel coverage It is the width in time shown on screen for the X axis Save to There are two options Internal or USB For Internal option it saves the file with all data in the internal memory of the eq...

Page 138: ...ode selected PA mode panoramic or MA mode cursor movement 5 LNB selected band battery level 6 Signal information window 1 Measurement where the cursor is 7 Signal information window 2 Date time and elapsed time 8 BScrollbar it shows position and size of the data displayed related to total data 9 Time span of displayed data 10 Menu Options F1 Exits the data viewer F2 It shows transmission parameter...

Page 139: ...le from the equipment to a USB memory using the Installation Manager See the equipment s documentation in how to get files from an Installation Obtaining an Excel File For this section you must have at least Excel 2003 or newer version Excel 2007 or later is highly recommended to avoid macro problems 1 First of all we need to locate the XML data file in the folder from which we want to work There ...

Page 140: ...ng This step could take few seconds depending on the size of the XML data file 7 At this point you should have an excel file with three different sheets Each sheet corresponds to a different view of the same data The first one will show you the generic signal information and the different coverage measures for each point acquired In the second one you will find the same data but presented in a tab...

Page 141: ...en and then a file explorer opens Select your data file COVERAGE XML exported from the meter 5 If the file is correct it opens a window with a series of options that allow you to customize the visualization Assign colors to the test points using a quality based color scale It assigns a color selected by the user for the worst quality value and another color for the best quality value For the inter...

Page 142: ...e the configuration of the file is finished click on the option Download your KML file for Google Earth 7 Click on the downloaded file in KML format COVERAGE KML It Should open the Google Earth program showing the measurement data over a 3D map The Datalogger function stores automatically measurements in a file set by the user name channel plan User can store for each datalogger measurements taken...

Page 143: ...e screen 3 Press the Tools key 4 Press on the Datalogger option 5 It displays a menu with the New Test Go option and a list of all dataloggers at the selected installation 6 Select New to create a new datalogger select Test Go to create a quick datalogger see next or select the file name of an existing datalogger if the user want to save data on a specific datalogger already existing 7 If New is s...

Page 144: ...er 2021 Figure 93 9 Next the user can select the terrestrial and or satellite channel plan to use in the datalogger The channel plans that are shown depends on the channel plans available for the current installation Figure 94 ...

Page 145: ... but provides more information about the services detected in the channel Pause before changing channel plan This option allows the user to enable a pause between channel plans the process stops until the user wants to carry on Skip Channels This option skip channels that are below the values defined in Preferences Measurement for more details refer to Measurement Options on page 51 ...

Page 146: ...starting the datalogger the system will create a new test point see next section Test points represent a specific point such a TV antenna socket Starting a datalogger 1 After creating a new datalogger file or selecting an existing one the user can start the datalogging process 2 From the datalogger viewer screen press the Test point key and from the menu select an existing test point using the Jum...

Page 147: ... by channel plan attenuation test To change the view of channel plan or attenuation test data press on the key Data about terrestrial and satellite attenuation will appear as the option TER ICT and SAT ICT respectively 6 It is also possible to download Datalogger files to a PC by the NetUpdate software free download on the PROMAX website Once downloaded the program can generate reports with these ...

Page 148: ...wer C N ratio MER time remaining to identify a channel elapsed time since the start of the channel identification 6 Softkey menus 7 Current channel plan progress bar in the current channel plan selected test point 8 Channel frequency and Downlink Screen Description Data Viewer Figure 99 Channel Plan Data Viewer ...

Page 149: ...nal type power level BER MER Link Margin Move the joystick up or down to navigate along the measurement data Press the joystick on a channel to display more signal parameters Carrier Noise C N rate etc 8 Softkey menus 9 Table with the measurement data for each pilot signal in the attenuation test In order from left to right number of pilot signal pilot signal frequency maximum attenuation allowed ...

Page 150: ...Delete Current It deletes the current test point Delete All It deletes all test points of the datalogger Datalogger Menu Options It cancels the datalogger It pauses datalogger until the user resumes by pressing again Test Go function inside the Datalogger tool allows the user to create a quick datalogger by creating automatically a new datalogger a new test point and then starting it Datalogger pa...

Page 151: ... an external software Settings 1 Press the Management Installation key for one second to enter Preferences menu 2 Go to the label Tools and select your option in Export button There are three options available Screen Only Data Only or Screen Data Screen Only saves the screen image in PNG format Data Only saves measurement data on screen in a XML file format Screen Data saves both screen and data 3...

Page 152: ...4 It appears a list of all the captures 5 Move up or down to find the file to be displayed 6 Leave the cursor on the file to be displayed It appears a progress bar that lasts a few seconds depending on the size Then the capture appears 7 To see the capture in full screen just press the Options key and then on the menu press View in Full Screen To exit the full screen view press any softkey 8 To de...

Page 153: ... signal to the equipment 2 Access Preferences by pressing the Installations key for 1s 3 At the Measures tab check the minimum values for the signal to be identified during the scan for more information refer to section Preferences Measures options 4 Press the Tools key 5 Select the Explore Channel Plan option 6 The first screen of Explore Channel Plan appears Figure 101 7 After the exploration th...

Page 154: ...the channel plan exploration In parentheses shows the number of detected channels to total channels of the channel plan When moving the cursor through the channels the spectrum and measurement windows are dynamically updated for the selected channel It allows you to select unselect channels to save them as a new channel plan At the bottom are the function keys They are detailed below Cancel during...

Page 155: ...kip during the process This option allows skipping the current channel and explore the next one in the channel plan Discard at the end of the process This option appears at the end of the exploration process It discards the results obtained from the exploration The Discover FM Stations tool scans the FM band and creates a FM channel plan from scratch Scanned frequency range is from 87 to 108 MHz T...

Page 156: ...surement It shows the cursor scrolling through each of the channels of the FM band On the bottom of the screen the channel and frequency appears next to the Power Level and the C N ratio In the spectrum area there is the Minimum FM Level This line is the minimum signal level required to identify the FM signal The channels below that signal level ...

Page 157: ...ocess It cancels the exploration before finish When pressing a confirmation message appears before cancelling Save at the end of the process It appears at the end of the exploration process It saves the results obtained during the exploration It is assigned a name by default to the channel plan but the user can modify the name using the virtual keyboard that appears prior to saving Each channel ta...

Page 158: ... antenna to the RF input of the equipment 2 Select a channel or frequency 3 Press the Tools key 4 Select the Field Strength option and in the drop down menu select On 5 Select again the Field Strength option now select the new option that appears called Configuration 6 In the configuration window enter the antenna calibration parameters by hand or selecting one of the available antenna types data ...

Page 159: ...ved for each channel for more details refer to Datalogger on page 130 9 Once finished return to the Tools menu and in the Field Strength option select Off The Field Strength configuration option allows the user to enter the correction factors for the antenna and cable used when measuring the field strength NOTE Some tools Constellation Echoes MER by carrier Merogram are disabled when the Field Str...

Page 160: ...to select between maximum PEAK detector or RMS detector The maximum peak detector is mainly used for analogue modulated signals while the RMS option is the right choice for digital modulated signals Cable Type In this box the user must select the type of antenna between manual and any other type of cable available If you select the manual cable you must enter cable loss by hand Loss dB In this box...

Page 161: ...ter the name by which the antenna will be identified maximum 8 characters 3 In the Description box type a description to identify the antenna 4 In the Impedance box select the impedance of the antenna between 50 and 75 ohms 5 In the Height box enter the antenna height in meters 6 Now fill the calibration table of the antenna with the K factor according to frequency 7 Do not change units when filli...

Page 162: ...s key 4 Select Import from USB option 5 The Import Files window appears Select the generated file and press the Import key 6 Press the Installation Manager key select the installation to which you want to add the antenna calibration table and press the Manage key 7 Press key Installation and select the Add Antenna option 8 Select the antenna to be added and OK 9 The antenna calibration table is no...

Page 163: ...ss the Tools key 2 Select the Task Planner option to access the Task Planner window that shows a list of scheduled tasks In the right column and next to each task there is its status if the date of the next execution appears then the task is pending if finished appears then the task has been executed if nothing appears then the task has not been scheduled Figure 108 3 To add a new task press Tasks...

Page 164: ... TV The options for type of capture are screen only data only or screen data for more details refer to Screen and Data Capture Export key on page 139 Figure 110 5 The Datalogger option performs the datalogger task The user must first select the datalogger from those available for the current installation If there not any datalooger task available the user must create one for more details refer to ...

Page 165: ...ving the timer for the task the upper right corner shows an icon of a clock indicating that the equipment has tasks pending to execute Figure 111 9 To change any parameter of the task check the box next to the task and press Parameters 10 To delete a task check the box next to it and in Tasks press Delete 11 After setting up the tasks press Exit Since this moment the timer for task execution start...

Page 166: ...peats each cycle of time days hours and minutes NOTE The equipment can be turned off after task planning as it will automatically turn on when the time to task execution comes Two tasks cannot be executed simultaneously It is recommended that the datalogger selected have not enabled the option to pause between channel plans since in that case the process would stop during the execution of the task...

Page 167: ...interest to research centres broadcasting operators universities or training centres as well as to installers that want to expand their technical knowledge or training in analysing the smallest unit of a digital signal transmission This tool has these main functions Tables It shows all the metadata carried in the corresponding PSI SI tables in a tree diagram so user can deploy its content to the d...

Page 168: ...appear 7 An error message pops up if the signal does not contain any TS or if the TS cannot be found In this case check the signal If the user cancels the table capture process no data about the TS will appear Then select Restart analysis on F4 to try capture the TS again The following describes in detail each one of these functions Description This function displays the TS tables When system star...

Page 169: ... locked multiplex name 7 Softkey menus Advanced It shows the Restart Analysis option which makes a new detection and updating of the TS tables Joystick functions Joystick left right It changes between Main menu tree and Detail menu tree Joystick up down It moves along the tables in the tree Joystick press Pressing on a node with the symbol it deploys the tree Pressing on a node with the symbol it ...

Page 170: ...rogram Association Table It is a master table that lists all services found in the TS being transmitted It also points the table where are specified each one of the services PMT Program Map Table It is a table that identifies all the components within a service video audio and or data NIT Network Information Table Optional table with information about TS and multiplex of a given network The conten...

Page 171: ...ime and date at the current moment and universal TOT Time Offset Table Table that provides the time offset related to UTC in order to calculate the local time It also provides information on daylight saving time changes Description This function shows the TS bitrate in a graphical way and also by numbers and percentage A pie graph which is updated in real time shows the evolution of the bitrate di...

Page 172: ... screen Services with a very low percentage are grouped with the legend Others 5 Detected services It shows all the services identified in the tuned multiplex and the percentage of each service relating to the total bitrate 6 Detail of the Selected Service Service name and percentage related to the total bitrate bitrate total bitrate 7 Bar graph representing the bitrate percentage for each compone...

Page 173: ... TS It is a dynamic tool as it displays in real time the evolution of the TS and the alarms that may occur The priority levels of alarms are set according to the recommendations by technical standards TR 101 290 Each alarm has a log where events are stored These data can be exported Main Screen Description Figure 115 1 Selected installation date and time 2 Selected function 3 Selected band Battery...

Page 174: ...3 Low level security parameters These are parameters that are not harmful but are required for getting the most from the receiver capabilities They ensure that the receiver can extract in the best conditions the TS information especially when there are additional features such as the program guide or the services list 7 Signal status searching locked multiplex name 8 Softkey menus Advanced It show...

Page 175: ... it will notify the alarm status on screen Log Size It allows the user to select the number of events stored 10 25 or 50 Order of events Select the order for keeping the events between keeping the first or the last ones To export the alarm log connect an USB memory to the equipment and press Export Data is exported into a plain text file Description This tool shows an ordered PID list with a short...

Page 176: ...ateway The T2 Gateway is assigning each MPEG 2 TS to a specific PLP Physical Layer Pipe and building up a more complex multi layered signal known as T2 MI T2 Modulator Interface The T2 MI signal includes synchronization data for SFN broadcast and furnishes the DVB T2 modulators with modulation parameters setup for each PLP T2 MI is exclusively used in the link between the T2 Gateway output and the...

Page 177: ... the user record the T2 MI signal into a file and play out that file containing the recorded T2 MI through the meter s TS ASI output Every type of T2 MI packet that has been found in the received stream is added to a hierarchial tree view where user can navigate through all parameters Screen Description Figure 118 ...

Page 178: ...nalysis option wich makes a new detection and updating of the TS tables It also show the Extract TS option which extracts and shows DVB SI tables that belong to the MPEG 2 TS encapsulated in the PLP Joystick functions Joystick left right It changes between Main menú tree and Detail menú tree Joystick up down It moves along the tables in the tree Joystick press Pressing on a node with the symbol it...

Page 179: ...gital signals To access the Transport Stream recording tool 1 Connect the signal to any of the equipment inputs 2 Access the Settings menu and in the Source Signal option select between RF or IPTV 3 Access the Settings menu and in the Decoder TS Input select from where comes the transport stream RF IPTV Demodulators or ASI Input 4 Press Tools and select the option TS Recording 5 It shows the scree...

Page 180: ...order to receive the corresponding type of signal NOTE The equipment only can play and analyze the last transport stream recorded Also the transport stream bitrate must be equal or less than 44 Mbits s and its size below 1 GB When not meeting these conditions the transport stream is stored on the internal memory but cannot be played or analyzed To manage these files use the Installations Manager I...

Page 181: ...attery level 3 Recording playback image 4 Recording Playback time elapsed 5 Control Keys Recording Rewind Stop Forward Play 6 File information window that reports about file duration the recording date and maximum bit rate 7 This window reports about the recording source 8 This window reports about available space and total space 9 Softkey menus ...

Page 182: ... recorded stream in an endless loop Record onto It allows to select where to save the TS between internal memory or external USB memory The Network Delay Margin function shows time delay of the transport stream from beginning to the final destiny All transmitters in a SFN Single Frequency Network must be synchronized Modulators at transmitters ensure that each bit of the transport stream is emitte...

Page 183: ...ion 5 The Network Delay screen shows up Screen Description Figure 121 1 Network delay margin difference between maximum acceptable network delay and measured network delay 2 Signal Detection Box Transmission standard detected Delay measured in the network Maximum acceptable delay in the network 3 Signal Status Box 1PPS pulse per second detected check not check CRC cyclic redundancy check status ch...

Page 184: ...l contains unwanted band limit and out of band components the shape of which has given rise to the term shoulder that tend to compromise the compliance with the mask limits Shoulders attenuation tool is available for digital terrestrial signals 1 Shoulder attenuation should be measured at the output of the power amplifier right before sending the signal to the antenna through the net of passive de...

Page 185: ...shows the Resolution of the bandwidth The Service Recording tool records in real time one digital service from the transport steam received that is shown on screen This service is saved directly on the USB flash drive memory connected to the equipment Afterwards that record can be played on a PC with a video player The Service Recording tool is available for all digital signals except for DAB digi...

Page 186: ...by pressing the STOP key 8 The recording file is saved in the PVR folder created by the equipment in the USB memory 9 The file name is PVR plus a consecutive number and the file extension is TS 10 The file can be played in a computer with a media player like VLC This file cannot be played from the meter itself Screen Description Figure 123 1 Installation selected date and time 2 Icons from left to...

Page 187: ... the bottom there are the function keys They are Exit Exits this function If exits when it is recording it does not stop the recording To stop press stop key Delete file It deletes files selected on the recording files window after a warning message Export to USB It copies files selected to the USB Advanced It allows user to select between record on internal memory or on USB The Tilt function disp...

Page 188: ...he band Tilt function is available for DVB C and DVB C2 signals 1 Connect signal to input and check in Settings the source signal is RF and band is terrestrial 2 Press Tools and select Tilt Scan option Then select Tilt option 3 Tilt function opens 4 Enter two pilot frequencies at the start of the band freq 1 and freq 2 and two pilot frequencies at the end of the band freq 3 and freq 4 5 Tilt appea...

Page 189: ...cess other tools Joystick functions Joystick up down Change of pilot frequency The Scan function shows on screen the signal level in a graph bar for each one of the channels in the channel plan The Scan function is available for all DVB C and DVB C2 signals 1 Connect signal to input and check in Settings the source signal is RF and band is terrestrial Select channel plan and tune a channel 2 Press...

Page 190: ...d measurement for the selected channel 4 Graphic bar of power for each channel in the selected channel plan The shadow area with a red arrowhead shows the selected channel 5 Softkeys F1 Change of channel channel plan or tune F2 Parameters for the tuned signal F3 Access tools Joystick functions Joystick left right Change channel ...

Page 191: ...changes and to quit Preferences Operation 1 Tune channel and service to broadcast in streaming 2 Connect the Ethernet cable to meter using the IP CTRL port 3 Press key Tools 4 Select Streaming V A option There are these options Start TS It starts streaming the complete Transport Stream all services Start Current Service It starts streaming the selected service Stop It stops streaming 5 The icon at...

Page 192: ...the computer see settings section If everything is right it will play the service on the computer screen 9 If you are streaming the whole TS open Playback from toolbar and select Program It will show all available TS services Select the service to watch on screen 10 To exit streaming press Tools select Streaming V A and then Stop ...

Page 193: ...UM Access the WiFi Spectrum screen which shows the spectrum signal over WiFi channels and detected Access Points 1 Connect the USB WiFi adapter supplied to one of the two USB ports on the device The Wi Fi Configuration window pops up and it performs a Wi Fi scan showing all networks detected The WiFi icon will appear at the top of the screen Press to exit because it is not necessary to log in a Wi...

Page 194: ...gs key to access the Settings menu and in Signal Source option select RF To connect to a WiFi access point you need to log in that network Configuration window is available when the USB WiFi adapter is connected to the device It shows up right after is connected It is also available as an option in Tools menu WiFi settings are Band Select the WiFi frequency band where to scan networks DHCP Enable ...

Page 195: ...any APs share the same spectrum and activity at any point on the spectrum All this information help user to determine the best place to place the AP or to analyze interferences on the spectrum To display the WiFi spectrum screen from the WiFi tuning mode press the Spectrum key Figure 126 1 Measurement CH When tuning by Access Point it shows the central channel for the Access Point selected The Acc...

Page 196: ...help to decide if this channel can accept another AP RSSI Received Signal Strength Indicator Power measured by the dongle USB WiFi adapter for the selected Access Point The dongle measures the power of a single AP and the meter measures the power of an area of the spectrum where there may be several APs For this reason and also for using different type of antennas on each device the power measured...

Page 197: ... allows the user to select between tuning by channel or tuning by access point Tuning by channel It allows you to select a channel or jump from channel to channel by pressing left right When the channel corresponds to an Access Point central channel the AP highlights and shows some information on screen RSSI and SNR Tuning by AP It allows you to select a AP or jump from AP to AP by pressing left r...

Page 198: ... on screen Resolution Bandwidth Resolution filters available are 10 kHz 20 kHz 30 kHz 40 kHz 100 kHz 200 kHz and 1000 kHz According to the filter being selected that maximum and minimum span allowed is modified Vertical Range It allows you to adjust vertical range on screen Available values are 1 2 5 and 10 dB per division This function shows a chart listing all Access Points detected and its main...

Page 199: ... Access Point CH Central Channel of Access Point RSSI Power in dBm of AP received This power is measured by the USB WiFi adapter Security Type of security to access the Access Point Device Name of device s manufacturer that provides infrastructure Not always available Joystick functions Joystick up down It changes Access Point 6 5 2 Screen Description ...

Page 200: ...ite Survey screen Advanced Menu View all parameters It shows a detailed report about the access point selected From Access Point Report screen Exit Returns to the previous screen Options Copy to USB If you insert a USB memory into a USB port you can copy the Access point report Page Up Page Down It scrolls through the report 6 5 3 Menu Options ...

Page 201: ... metrics is not the same in IPTV as it is in digital TV over RF The equipment offers you the measurements you need to understand identify and correct the new problems that can be found in this new type of television distribution networks 1 Connect the IPTV input output signal to the equipment through the Ethernet IPTV connector 2 In Preferences menu press for one second tab IPTV set parameters to ...

Page 202: ...hin the receiving buffer of the equipment measurement done over the last second of data received recommended value 100 ms Media Loss Rate MDI Ratio of lost packets to received packets in one multicast stream only for RTP protocol after FEC recommended value 0 005 pkt s Resources Busy Resources busy shows the of equipment resources used for handling current IP traffic Arriving at 100 means the rece...

Page 203: ... Figure 130 1 Selected installation date and time 2 IPTV mode enabled battery level 3 Image of the tuned signal 4 Measurements on the data network Delay Factor Media Loss Rate and Resources busy for more details refer to next section 5 Measurement on the multicast reception received packets RTP missing packets FEC fixed packets buffer usage stable reception and TS bitrate if TS input has many vari...

Page 204: ...ts RTP missing packets FEC fixed packets buffer usage TS locked unlocked and TS bitrate 5 Measurements over all traffic data in the network network bitrate IP packets with errors and IPER IP Packet Error Ratio ratio of Ethernet packets with errors to Ethernet packets received 6 Softkey menus for more details refer to Settings on page 199 IPTV view in Spectrum Analyzer mode shows the Interarrival p...

Page 205: ...ctober 2021 193 Chapter 7 IPTV Figure 132 Interarrival Packet Time Figure 133 Packet Rate Over Time 1 Selected installation date and time 2 IPTV mode enabled battery level 3 There are two specific tools ...

Page 206: ...IP packets Packet Rate Over Time This graph shows the number of IP packets being received from the current streaming over time 4 Advanced For Interarrival Packet Time allows to change span 4 8 40 200 400 and 1920 ms or restart analysis For Packet Rate Over Time allows change resolution 1 5 10 50 200 and 1000 ms or restart analysis Figure 134 IP TV 1 3 1 Selected installation date and time 2 Number...

Page 207: ...Number of view total views 5 IPTV mode enabled battery level 6 Tuned service information NETWORK Television distribution network PROVIDER Program provider name NID Network identifier where the signal is distributed ONID Identifier of the original network where the signal originates TSID Transport stream identifier SID Service Identifier App Type Type of detected interactive service such as HbbTV M...

Page 208: ...language PID ID of the audio program 8 Multicast IP address and name of the selected service 9 Softkeys menu for more details refer to Settings on page 199 Press Tools to access tools for IPTV mode The IP Ethernet Frame Viewer Ping and delay measurements and View IP Network log are specific tools for IPTV The other tools TS Analyzer TS Recording Service Recording Streaming V A Network Delay and Ta...

Page 209: ...l Range of addresses to apply the ping test It adds the number selected to the original IP address 2 Click on IP Address and enter the IP address of the remote machine you want to check its communication It works for both local network or external network 3 Press Start The equipment starts sending data packets to the IP address of the remote machine 4 If it gets response on screen appears the mess...

Page 210: ...otocols IGMP PING ARP DHCP and also Ethernet link detection Data shown is date hour and a description Figure 137 Options The log can be exported to an USB flash memory or be cleared This function only works for Multicast streaming 7 4 2 View IP Network Log 7 4 3 IP Ethernet Frame Viewer ...

Page 211: ...how header data of each protocol available Ethernet IPv4 UDP and RTP Multicast The IPTV tuning options are on Multicast These options are available to receive a multicast signal Multicast is an open broadcasting over IP in which the device only takes data packets with a specific address For multicast distribution options are Multicast Address Multicast address at which the equipment is subscribed ...

Page 212: ... protocol FEC status and TS packets IP frame Tools It access tools for IPTV mode The IP Ethernet Frame Viewer Ping and delay measurements and View IP Network log are specific tools for IPTV The other tools TS Analyzer TS Recording Service Recording Streaming V A Network Delay and Task Planner are generic and its explanation and operation can be found in Tools chapter TOOLS on page 93 Advanced Ther...

Page 213: ...urrent stream and asks for receiving the new one IGMPv3 IGMP version 3 Each time user selects a multicast address meter stops receiving the current stream and asks for receiving the new one from the servers approved by the user Off Meter does not send any IGMP messages and discards the received ones General Settings When pressing the settings key it shows IPTV settings Signal Source It allows the ...

Page 214: ... right quality at a certain time This information is contained in the HLS MANIFEST file or in the MPEG DASH MPD file Media Presentation Description The meter can retrieve and display the information of these files and download the selected content by segments and also it shows the download bitrate in a graph 1 Connect the OTT signal to the meter through the IP CTRL port 2 Press Settings and select...

Page 215: ...sentation OTT 1 2 screen shows detailed information about the selected stream OTT 2 2 shows the sequence of segment requests and result OK failed To view the OTT segment download bitrate in a graph press Figure 139 1 URL selected 2 Representation selected resolution and profile 3 System messages log 4 Standard status 5 Softkeys menus for more details refer to Menu Options on page 205 Joystick func...

Page 216: ...Chapter 8 OTT 204 October 2021 Figure 140 Log for Segment request and status Figure 141 1 URL selected 2 Representation selected resolution and profile 8 3 2 OTT Segment Bitrate ...

Page 217: ... This axis re scales according to biggest value At the bottom of the screen there are some menus available via the function keys URL It shows a screen with a list of available URL from which download segments It also allows you to import URLs from a file on a pendrive This pendrive must have a file named OTT URL on the root in order to be imported View There are two options Presentation Descriptio...

Page 218: ...l be stored in the folder corresponding to that installation These measures can then be displayed and downloaded to a PC If the user does not create any file installation the equipment stores measurements in the installation file by default named DEFAULT 1 To access the Installations menu press the key 2 It shows up a window with a list of all available installations On the softkeys appears the op...

Page 219: ...llation Manage It opens a window that displays all data of the current installation and from where they can be edited changed or view for more details refer to next section Create New It creates a new installation with the data introduced by the user for more details refer to next section Tools It shows up a menu with some tools to use with the installations see Tools section The DEFAULT installat...

Page 220: ...installation These can be screenshots channel plans dataloggers DiSeqC commands data captures signal monitoring service databases and antennas To move along this file list move the joystick up or down Any of these files can be selected or deselected by pressing the joystick 3 File Description Area It shows file name extension creation date and time and size Menu Options The installation manager me...

Page 221: ...pdate program To do this the datalogger files must be exported directly through the NetUpdate program for more details refer to NetUpdate manual on PROMAX website Send via mail It allows you to send files selected from the file list via e mail Mail server parameters must be defined on the SMTP tab at Preferences for more details refer to SMTP Options on page 55 Installation Add Channel Plan It ope...

Page 222: ...allation At least one for each band has to be selected 3 For satellite channel plans the user can select the Diseqc commands associated to the installation and also the satellite band Ku Ka or C band and the frequencies of the LNB Oscillator 4 During the creation process the softkeys functions are Next it goes to the next step Previous it goes to the previous step or Cancel it cancels the process ...

Page 223: ...ort from USB It imports installation files from a USB stick connected to the equipment It has to use the same folder structure that is generated when exporting to USB for more details refer to next section Installed Antennas It allows you to remove antenna files on the meter The data import tool allows the user to import data files in a simple way from an USB flash drive to the equipment Data avai...

Page 224: ...Chapter 9 INSTALLATIONS MANAGEMENT 212 October 2021 Figure 144 Import Files window 6 If the file import is successful then a window shows a confirmation message ...

Page 225: ...s you to interact with the meter in first person Quality Signal Monitoring It monitors a signal according to some parameters selected by the user Historical Monitoring It shows data from monitoring and they can also be exported Installations Management It manages installation files and creates channel plans Task Management It allows the user to schedule some tasks There is also an option on demand...

Page 226: ...IP for your PC is 10 0 1 18 the meter must have a free IP in the same range like 10 0 1 50 4 In the Mask box enter the mask value which should be the same as the one used by the local network usually 255 255 255 0 if you do not know these data see find out local network data section 5 To connect the meter from an external network fill in the Gateway with the info obtained from the local network 6 ...

Page 227: ... your PC Write down this IP Also write down Subnet Mask and Default Gateway This data is needed to configure the meter by hand Remote Access 1 From a remote access device PC mobile device run a standard web browser Chrome recommended 2 On the address bar write the address to remotely access the meter 3 If the connection is successful it should appear on screen the webControl welcome screen see fig...

Page 228: ...ry code shown on the window 2 Once this information is sent it is checked and if everything is right a temporary password is sent back Write this password on the box temporary password This password is for one time use 3 If you have access to the main screen go to Config on the upper right corner and click on Change Password 4 A window will appear to change the password Enter the temporary passwor...

Page 229: ...iption Icon Description Installation Monitoring Terrestrial Band WiFi Connection Satellite Band USB connected Battery level Notification Battery charging HDMI connection Emulating Hard drive detected in use Pending tasks GPS enabled Cleaning database Warning Audio recording Transport Stream recording Audio streaming Transport Stream streaming ...

Page 230: ...llows modifying the reference level span type of tuning and channel plan among others To communicate you need at least 200 kB s of bandwidth To access this screen click on Measurement icon Screen Description Figure 146 1 Selected function Measurements and Spectrum 2 Source of Signal Error Warning full memory 10 4 Measurements and Spectrum Icon Description Icon Description ...

Page 231: ...rameters 6 If shows if signal is locked unlocked If locked it shows its multiplex 7 Selection parameters Tuning type channel frequency selection and channel plan 8 Signal data Power C N MER CBER VBER Offset LM 9 Spectrum graph 10 Spectrum settings parameters reference level center frequency span and analyzer automatic reference level spectrum reference level set by user mode Description TV Paramet...

Page 232: ...ion Logout It exits your current session 5 Signal settings When clicking on a button it shows settings for the current signal and also they can be changed Terrestrial Satellite settings band external power supply power voltage LNB drain Tuning type settings tuning by channel frequency channel channel plan frequency Tuned signal parameters 6 If shows if signal is locked unlocked If locked it shows ...

Page 233: ...V Select a name and press Start Audio Record It will start to record and will show some data about the service being recorded like total time space available and location When finish press Stop Audio Record TS Streaming It allows you to stream the selected service Enter the IP address and port to stream and press Start Streaming for more details about Streaming refer to Streaming V A on page 179 W...

Page 234: ...ion button 5 Joystick Click left right up or down to simulate joystick movement Click on centre to simulate enter You can use the joystick to move along the menus and to select options Also you can use your mouse pointer like a finger touch on screen 6 Direct Access keys to access Installation management and Settings Press for more than one second to access Preferences and Video Audio settings 7 D...

Page 235: ...to NTP Options on page 55 2 In Preferences label Utilities option Moni ddbb loc select where the monitoring data will be stored internal memory or hard disk for more details refer to Tools Options on page 42 3 You need a channel plan with special information for monitoring To do that create a new channel plan from an existing one using the Explore channel plan tool in the meter Explore Channel Pla...

Page 236: ...es the channel and waits during a time defined by user in seconds Then it takes measurements and reports an alarm when the user defined condition is met Cycles The system reports an alarm when the user defined condition is met during a number of consecutive cycles defined by user If this box is empty is equal to 1 cycle 8 When the channel is deployed the alarm configuration will appear Status unlo...

Page 237: ...ferences SNMP tag for more details refer to SMTP Options on page 55 15 To stop press on Stop Monitoring or cancel remote control on the meter 16 Data obtained can be requested on Historical Monitoring screen Screen Description Figure 149 Monitoring Edition Creation 1 Selected function Monitoring 2 Monitoring selection On Monitoring type select Signal Quality Monitoring On Monitorings select one ex...

Page 238: ...erences menu Screen Description Figure 150 Monitoring started 1 Parameter selected shown on graphic bar 2 Start Stop monitoring 3 Graphic bar of selected parameter At the bottom the channel being measured When pressing on a graphic bar channel it pops up a window with measurements If there are too many channels to show on screen drag and drop to see the rest of them 4 Current monitoring data Monit...

Page 239: ...ain data 3 In the Channels box select the channel from which you want to obtain data For all channels select All 4 In the Measurement box select the parameter from which you want to obtain data For all parameters select All 5 Select the start and end date and time for the monitoring data query It must be the local date and time for meter 6 Check the box Measurements or Alarms if you want to see th...

Page 240: ...or historical data query Monitoring Type Select Signal Quality Monitoring Monitoring Select monitoring to obtain data Channel or all channels Measurement type or all measurements Date and time from to 5 Data table graph graphic bar is only displayed when one single channel and one measurement type is selected Click on the corresponding label to switch between Table and Graph Alarms table shows whe...

Page 241: ...shown on the left side of the window Each folder is for an installation When clicking on a folder it deploys its content in a tree structure The area on the right side shows the content inside the selected folder 3 The padlock icon on an item means that it cannot be removed If the padlock is on a folder it also means that its content cannot be change nor deleted or added 4 To make any action on an...

Page 242: ... format Preview It shows file info Upload files It transfers a document from your PC to the meter It shows a window where you can drag files paste URLs or images or select files or folders from your PC Delete It deletes the folder or file selected Edit Channel Plan It allows editing a channel of the equipment It only works if a channel plan file XML extension is selected The channel plan files are...

Page 243: ...nstallations Management Screen Figure 152 File Manager 1 Selected function Installations Management 2 Tabs to select the File Manager or the Channel Plan Creator 3 Toolbar 4 File navigation area 5 Selected installation current date and hour and access to settings Change Password It allows you to change your password Reboot Equipment It allows you to reset your meter after confirmation In case you ...

Page 244: ...uency are specially indicated to use it for LTE signals 3 Press the Add Channel button and enter one by one each channel that made the channel plan Enter channel name frequency and signal type for each channel 4 Edit each parameter by clicking on it Remove a channel clicking on the red cross 5 Once finished press on Download Channel Plan to download it on your PC By default the channel plan file i...

Page 245: ...l plan definition parameters and all the channels that form it will appear From here you can edit any value by clicking on the box 3 Channels can be modified by clicking on each parameter or deleted by pressing the red cross 4 Once the channel plan is finished click on Download Channel Plan to download it to the PC By default the file with the channel plan is downloaded in the PC Download folder T...

Page 246: ...ntrol To access this screen click on the Task Management icon Operation 1 Press on New Task 2 When creating a new task fill in these fields Task Type Type of scheduled task Options are Signal Quality Monitoring Mask Monitoring Datalogger more details in Datalogger on page 130 TS Record more details in Transport Stream Recording on page 167 Audio Record It records the audio from the selected servic...

Page 247: ...w long run your task Execute every It allows you to select when to repeat your task Repetition Type It allows you to select time scale for repetition hourly minutes hours repetition weekly week day repetition monthly month day repetition Figura 154 Task Settings Screen 3 Once the task has been set press on Done to save it or Remove to remove it 4 If one task tries to start when another task is run...

Page 248: ... Management Screen Description Figura 155 Task Management 1 Selected function Task Management 2 Button to set a new task 3 Scheduled list task with info from each one task type repetition type start date expiration date and last execution status ...

Page 249: ...d margins the system will notify the user The maximum number of records to store in the meter s internal database is 500 000 How long it takes to reach this number of records depends on different factors especially the Time Period Once this amount is exceeded oldest records are overwritten Data can be exported from the monitoring history to a CSV file To access this screen click on the Monitoring ...

Page 250: ...reated and exported using the Export option 3 When creating a new mask monitoring fill in these fields Name Name to identify your monitoring Description Monitoring description Units Measurement units dBuV Sample Period ms It saves a spectrum each time period defined in this field Band Select between satellite or terrestrial band Num Inputs Select the input number to be monitored Input For each inp...

Page 251: ...ber of consecutive times that the threshold condition must be met to trigger the alarm Spectrum Start Freq Start frequency to monitor End Freq End frequency to monitor Reference Level It must be set to a proper level according to the antenna to avoid saturation or not viewing the signal Average Count It allows the user to select the number of signal values to be used as average to establish the si...

Page 252: ... has been obtained save by pressing Save 10 Saved reference spectrum will appear on the box Mask Monitorings 11 To start a mask monitoring select a reference spectrum in Mask Monitorings select an input and press Start Monitoring to start 12 Monitoring screen shows measurements and alarms from the last cycle When clicking on a channel it will show some additional info 13 Alarms are notified by sen...

Page 253: ... box with the monitoring description 3 Reference spectrum thresholds red horizontal lines and detected stations black dots 4 Start Stop monitoring 5 The Delete button deletes the selected monitoring and the button New creates a new monitoring 6 It shows a list of e mails When an alarm is triggered a notification is send to each one of these e mails It allows you to add e mails in the box add a new...

Page 254: ...onitoring Creation Edition 1 Reference spectrum thresholds red horizontal lines and detected stations black dots 2 Settings parameters for reference spectrum 3 Detected stations for FM detection For other type of detection it shows Thresholds for Max Min detection Deviation for Deviation detection ...

Page 255: ...ctrum at monitoring frequency band for the detection type selected in this case for FM detection Horizontal red lines are the upper and lower threshold 5 Alarm window It shows alarm data from the last cycle with a description and date and hour when it was detected Only shows active alarms When the condition that trigger the alarm no longer met then this alarm disappears in the next cycle although ...

Page 256: ...rom which you want to obtain data 4 Select the start and end date and time for the monitoring data query It must be the local date and time for equipment 5 Press Done and wait a few seconds to visualize data All alarms triggered are shown on screen with start and end date channel and a description 6 When clicking on start end date on an alarm it shows the spectrum graph when the alarm was triggere...

Page 257: ...om the historical data Monitoring Type Select Mask Monitoring Monitoring Select monitoring Input Select input From to Select date range Done Press to run query 3 Data table Data graph Data table shows date start and data end for each alarm When clicking on any data and hour it shows the spectrum graph in that time moment see next figure Measurement units are the same than the units selected when c...

Page 258: ...Chapter 10 WEBCONTROL 246 October 2021 Historical Mask Monitoring by Detection Type Figure 160 Spectrum Graph Monitoring FM detection Figure 161 Spectrum Graph Monitoring Max Min detection ...

Page 259: ...October 2021 247 Chapter 10 WEBCONTROL Figure 162 Spectrum Graph Monitoring Deviation Detection ...

Page 260: ...nector CAM modules input via Common Interface slot TS ASI Input Output via F connector Next is described each of these interfaces and their interaction with external devices Devices that can connect the meter via USB port are USB flash drive USB WiFi adapter dongle GPS signal receiver Both USB ports can be used for these devices This connection allows the user to copy files screenshots channel pla...

Page 261: ...y file has been selected 8 It shows a progress bar and a message informing that files are being copied to the USB 9 When finish you can remove the cable with the USB stick memory directly from the equipment and connect it to a computer to view the files copied 10 Default files are copied to the root directory of the USB memory Screenshots appear with PNG extension and data with XML extension To ex...

Page 262: ...g before import This connection is necessary for the use of the equipment as a WiFi meter see WIFI MONITORING on page 181 for more details or to connect to a WiFi access point and use the meter remotely with the webControl tool see WEBCONTROL on page 213 The GPS Signal Receiver is needed for the Signal Coverage tool This tool takes measurements linked to a geographic position determined by the GPS...

Page 263: ...ork data For instance if the IP for your PC is 10 0 1 18 the meter should have a free IP in the same range like 10 0 1 50 5 In the Mask box enter the mask value which should be the same as the one used by the local network usually 255 255 255 0 6 To connect the meter from an external network fill in the Gateway with the info obtained from the local network 7 Press on Save and then Exit to save cha...

Page 264: ...PC All permissions requested during the installation must be approved for a correct operation of the program 2 Switch off the meter Use an Ethernet cable to connect the meter s IPCTRL port to a switch or to the PC s ethernet port Switch on the meter 3 Open the NetUpdate program In the Select Port box select Ethernet option and press Detect 4 A window will appear where you must enter the same IP th...

Page 265: ...ected by the user Historical Monitoring It shows data from monitoring and they can also be exported Installations Management It manages installation files and creates channel plans Task Management It allows the user to schedule some tasks For more information about webControl refer to chapter WEBCONTROL on page 213 Description The design of this meter is based on a microprocessor which allows data...

Page 266: ...ar a window with a command line where you can write and send remote control commands download Remote Control Commands from PROMAX website for more details Description SFTP SSH File Transfer Protocol is a protocol to transfer and edit files which uses SSH to provide security into the data stream Operation 1 Install a program to connect via SFTP like FileZilla in your device 2 Through an Ethernet ca...

Page 267: ...auxiliary monitor by following these steps 1 Connect the HDMI cable to the video audio output connector ensuring that the plug is fully inserted 2 Connect the opposite end to the auxiliary monitor where video and audio of the equipment will be played The V A input connector allows connecting a video audio analogue input signal This connection allows the user to view an image on the meter screen co...

Page 268: ... Press the Settings key and select the satellite band 4 From the Settings menu select the polarization horizontal vertical and the satellite band high low 5 If necessary enable the Supply output and select the supply voltage for the LNB 6 Select the option DiSEqC mode 7 Two new functions appear on the softkeys Command and Software DiSEqC programs appear classified in categories or folders 8 Select...

Page 269: ...ector for the input signal of the equipment 2 Press the Spectrum key to access the Spectrum analyzer mode 3 Press the Settings key and select the satellite band 4 Select the polarization horizontal vertical and the satellite band high low 5 If necessary enable the Supply output and select the supply voltage for the LNB 6 In the option SCD EN50494 select ON to enable it It appears the icon at the t...

Page 270: ...m one type to another 8 Once SCD EN50494 is configured the user can select the slot by the Tuning key Through the SCD2 EN50607 internation standard also known as JESS function is possible to control the devices of a TV satellite installation that are compatible with this standard This technology has two main functionalities one for configuring headends and another for configuring sockets This tech...

Page 271: ...t ON to enable it It appears the JESS icon at the top right corner of the screen 6 Now the SCD2 EN50607 option shows a new menu Select Configuration to access the configuration parameters The user can select the power central frequency tone beacon and satellite for each band The user can also select the number of user bands and the available satellites through the option Configuration on key Figur...

Page 272: ...which a valid CAM module exists according to DVB CI with the corresponding subscriber card The equipment by means of Common Interface method offers the possibility of supporting various conditional access systems so that video and or audio broadcast by encrypted services scrambled TV for subscribers may be decoded NOTE When not detecting any SCD2 receiver the function enters in a more basic mode a...

Page 273: ... Figura 166 2 Insert the CAM module in the Common Interface slot of the equipment The CAM module connector is located on the equipment rear panel Place the instrument on a stable surface and insert the module so the printed arrow appears on the visible upper face pressing until the extractor mechanism button becomes visible 3 If the equipment detects the CAM module it shows a confirmation message ...

Page 274: ...te receivers transport stream players multiplexers etc It automatically detects whether the stream is composed of 188 or 204 bytes Operation 1 Press the Settings key to access the settings 2 Select the Decoder TS Input option It shows up a menu to select the transport stream coming into the equipment between the RF Demodulators IPTV and the ASI Input 3 The RF Demodulators option this option is ava...

Page 275: ... By this way the transport stream can feed another device 3 The Off disables the ASI Output If the RF Demodulators option this option is available only if RF is selected as a Signal Source is selected the signal through ASI Output is the TS extracted from the RF signal by means of the internal RF demodulator The RF signal can come from digital terrestrial satellite or cable If the IPTV option is s...

Page 276: ...ositive video Analogue Audio Input Input Connector Multipole Jack Zin 10k same V A input multipole jack Digital Video Audio Output Output Connector HDMI 1080p Resolution USB Interface 2 0 Connector USB type A Features Mass Storage Host Can read and write on a pendrive USB CDC USB CDC CDC Communication device class Communication Software NetUpdate Functions Installation management and firmware upda...

Page 277: ... mA 22 kHz Signal Voltage 0 65 V 0 25 V Selectable in Satellite band 22 kHz Signal Frequency 22 kHz 4 kHz Selectable in Satellite band DiSEqC Generator DiSEqC 2 2 DiSEqC 1 2 commands implemented DiSEqC is a trademark of EUTELSAT SATCR SCD EN50494 Available DiSEqC 1 2 dCSS SCD2 EN50607 Available Compatible with LNB SKY UK According DiSEqC 2 x Parameter Value Additional Data Dimensions 290x185x95 mm...

Page 278: ...s Parameter Value Additional Data 1x 0 MT0170 Antenna Dual WiFi 1x 0 MF0213 USB WiFi adapter 1x 0MF0214 USB cable 1x 0 CO6861 Aero SMA H BNC M adapter 1x ___ for RANGER Neo 3 and RANGER Neo 4 GPS receiver 1x CC 046 Jack 4V RCA cable 1x AA 103 Car lighter charger 1x AL 103 External DC charger 1x AD 055 F f BNC f adapter 1x AD 056 F f DIN f adapter 1x AD 057 F f F f adapter 1x CA 005 Mains cord 1x C...

Page 279: ...cing symbol interleaver and MPE FEC Tuning Range 45 1000 MHz Parameter Value Additional Data Profiles T2 Base T2 Lite Modulation COFDM Margin of Power Measurement 35 dBμV 115 dBμV 786 MHz 32k GI 1 32 256 QAM Rotated CR 3 5 Sensitivity QEF 30 dBμV Measurement Power CBER C N LBER MER Link Margin BCH ESR LDP Iterations and wrong packets LBER measurement under 1E 10 Displayed Data Numeric and level ba...

Page 280: ...e Additional Data Modulation QAM Margin of Power Measurement 45 115 dBμV 786 MHz 32k GI 1 128 1024 QAM Rotated CR 9 10 Sensitivity QEF 48 dBμV Measurements Power CBER MER C N LBER BCH ESR LDP Iterations and wrong packets Displayed Data Numeric and level bar Carriers 4k Guard Interval 1 64 1 128 Bandwidth 6 8 MHz Spectral Inversion ON OFF Auto Pilot Pattern PP1 PP8 Code Rate PLP 2 3 3 4 4 5 5 6 8 9...

Page 281: ...2 15 GHz 2 MSs 30 dBµV a 2 15 GHz 27 MSs 33 dBµV a 2 15 GHz 45 MSs Measurements Power CBER MER C N and Link Margin Displayed Data Numeric and level bar Symbol Rate 1 45 Mbauds Roll off α factor of Nyquist filter 0 35 Auto Code rate 1 2 2 3 3 4 5 6 7 8 Spectral Inversion ON OFF Tuning Range 250 2350 MHz From 2150 to 2350 MHz does not meet sensitivity specifications Parameter Value Additional Data M...

Page 282: ...nge 250 2350 MHz From 2150 to 2350 MHz does not meet sensitivity specifications Parameter Value Additional Data Modulation QPSK Margin of Power Measurement 35 dBμV 115 dBμV Measurements Power CBER VBER MER C N and Noise Margin Displayed Data Numeric and level bar Symbol Rate 20 Mbauds or variable Auto detected Roll off α factor of Nyquist filter 0 2 Code rate 1 2 2 3 6 7 and AUTO Spectral Inversio...

Page 283: ...μV a 3 16 V Span min max 200 kHz 40 MHz for RBW 2 kHz 1 MHz 250 MHz for RBW 10 kHz 2 MHz 450 MHz for RBW 20 30 40 kHz 10 MHz 995 MHz for RBW 100 200 1000 kHz Digital channels measures Channel power C N MER BER LM According to modulation type Satellite Tuning range 250 2500 MHz Tuning mode Intermediate frequency or downlink Channel plan configurable tune step 50 kHz Tuning accuracy 2 6 kHz Tuning R...

Page 284: ...μV 250 1800 MHz 20 dBμV 1800 2300 MHz 24 dBμV 2300 2500 MHz 31 6 μV 3 16 V Analogue channels measurements Level C N According to modulation Accuracy 1 5 dB 20 dBμV 130 dBμV 2490 MHz 10 μV 3 16 V 23 C 5 C Out of range indication 12 4 TV Mode Parameter Value Additional Data Codecs MPEG 1 MPEG 2 MP HL Main profile high level MPEG 4 AVC H 264 High Profile Level 4 1 maximum bitrate 40 Mbps H 265 L4 1 M...

Page 285: ... NID ONID scrambled free TSID SID LCN Audio Info Type bitrate format frequency mono stereo language PID Max Recording Bitrate Up to 66 Mbit s Between 44 and 66 Mbit s the TS recorded cannot be played or analyzed Memory for Recording 1 GB 12 5 WiFi Analyzer Mode 2 4 GHz Parameter Value Additional Data Band 2 40 GHz Resolution Filter 100 kHz Reference Level Available RSSI Available dBm Depending on ...

Page 286: ...todetection of crossover cables Available M3U files compatibility Available 12 7 Tools Parameter Value Additional Data Type of Signal DVB T DVB T2 DVB C DVB C2 DSS DVB S and DVB S2 Displayed Data I Q Graph Parameter Value Additional Data Type of Signal DVB T DVB T2 DVB C2 Measurement range Depends on the standard carrier and guard interval Delay 0 1 224 us Typical configuration DVB T 8K GI 1 4 Dis...

Page 287: ...al Data PSI Tables PAT Program Association Table PMT Program Map Table NIT Network Information Table CAT Conditional Access Table SI Tables NIT Network Information Table BAT Bouquet Association Table SDT Service Description Table EIT Event Information Table TDT Time and Date Table TOT Time and Date Table Bitrate Maximum 80 Mbit s Alarms According to ETSI standard TR101 290 v1 2 1 Sections 3 3 3 9 ...

Page 288: ...ion 5 dBm 10 dBm RF Attenuation ON 15 dB OFF 0 dB RF band converted Optical Cable and DTT links 65 MHz 1000 MHz RF band converted Optical IF Satellite Installations 950 MHz 5450 MHz for universal optical LNB RF Output 65 MHz 2150 MHz 6 GHz RF Auxiliary Input Connector SMA Frequency Bands Sub Band 1 2150 MHz 3000 MHz Sub Band 2 3400 MHz 4400 MHz Sub Band 3 4400 MHz 6000 MHz Dynamic Range 45 105 dBμ...

Page 289: ... protection ratio Sensitivity just before synchronization is lost 14 dBμV Measurement Power C N MER CBER MSC CBER FIC CBER FIB Ratio All CBER measurement can go down to 1E 8 MER measurement exceeds 40 dB Spectral Inversion ON OFF Auto TII Detect up to 8 different TII signatures TII signatures can be detected if SNR is higher than 0 dB Constellation Available MER by carrier Available Echoes Availab...

Page 290: ...deviation caused only by RDS Available Histogram 50 ms according to recommendation ITU R SM 1268 2 Available It measures the maximal value of frequency deviation in 50 ms and then accumulate them into the histogram Histograms classify frequency deviation from 0 Hz to 150 kHz in binds of 200 Hz Histogram All Values according to recommendation ITU R SM 1268 4 Available It accumulates all values of f...

Page 291: ...is greater than 35 cm with a viewing angle of 90 between the eye and the screen should not be considered manufacturing defects either It is advisable a viewing angle of 15 in the 6 00 o clock direction in order to obtain the optimum visualization of the screen The equipment consists of a plastic case and a TFT screen Each element has its specific cleaning treatment Cleaning the Screen The TFT scre...

Page 292: ... before cleaning the case The case must be cleaned with a solution of neutral soap and water using a soft cloth dampened with this solution Before use the equipment has to be completely dry Never clean with abrasive soaps chlorinated solvents or aromatic hydrocarbons These products may degrade the case ...

Page 293: ...tion has been developed It is applicable to the field strength meter and allows adapting it in order to work with fibre optics networks The selective meter option allows measurements on optical fibre networks which are necessary to certify an installation according to the parameters set by local policies The optical to RF selective converter has a photosensor for each wavelength which obtains the ...

Page 294: ...ives a signal and converts it to a frequency within the RF band 65 2150 MHz In the case of a terrestrial cable signal the signal is not converted since that signal is within the RF range After the conversion the RF signal output is connected to the analyzer input connector and the measurement is performed in the usual way to an RF signal In the conversion bear in mind that for every unit of optica...

Page 295: ...allation according to the telecommunications infrastructure policies Operation To access the Fibre Optical Test tool 1 Connect the optical input signal to the optical input of the equipment 2 Press the Tools key 3 Select the Fibre Optic Test option 4 It appears the screen to perform the Fibre Optic Test on the signal Figure 167 ...

Page 296: ...el of reference signal which is used to calibrate and calculate the attenuation level dBm 5 Power level of test signal at the user s access point dBm 6 Attenuation level dB Attenuation Current Reference 7 Advanced key to access these options Threshold attenuation and Max attenuation see Max dashed line 8 Exit button to exit the screen 9 Set Reference key to calibrate the reference signal ...

Page 297: ...defines the attenuation level used by the field meter to display the status message on screen If the attenuation level is below this value the status message will be PASS and if it is above this value the status message will be FAIL Next there is a step by step example to certify a telecommunication installation of optical fibre by using the optical module To make the required certification it is ...

Page 298: ... Set Reference All current values are captured which will be used as reference values 8 Now user can proceed to Stage 2 in order to measure the attenuation at each user s access point Figure 169 Stage 2 Attenuation Test Measurement 1 Connect the PROLITE 105 in a source node of the transmission optical net work for example in a free strip of the main telecommunications cabinet of the building 2 Kee...

Page 299: ...Connect the field strength meter to a receiving node of the optical network that is going to be measured such as for example in a UAP User Access Point 4 Using the field strength meter check measurements on the Fibre Optic Test screen Figure 170 ...

Page 300: ...estrial cable signal the signal is not converted since that signal is within the RF range After the conversion the RF signal output is connected to the analyzer input connector and the measurement is performed in the usual way to an RF signal In the conversion bear in mind that for every unit of optical attenuation one dB occurs two dBs of power loss in RF As an example every 3 dB of optical atten...

Page 301: ... defined by the channel refer to the Settings menu section for more details 3 Select the Optical module option and press the joystick 4 It appears a window to enable the optical module and to configure additional parameters 5 Select Enable 6 At the top right area of the screen appears the OPT icon meaning there is external power 7 It appears a window with some setting parameters Figure 172 In this...

Page 302: ...ications to directly connect optical LNBs with 5 4 GHz output The RF input works for three bands Band I From 2150 MHz to 3000 MHz Band II From 3400 MHz to 4400 MHz Band III From 4400 MHz to 6000 MHz Connection Figure 173 1 SMA Connector RF aux input signal Settings Follow these steps to set i 4 6 GHz Auxiliary RF Input ...

Page 303: ...October 2021 291 Chapter i OPTICAL OPTION Figure 174 Auxiliary Input Signal Selection Figure 175 Band Selection ...

Page 304: ... 5 Auxiliary RF Input Enabled 6 Central Frequency Description The 5 GHz WiFi option extends the WiFi Analyzer to the second frequency range used for WiFi Operation 1 Connect the USB WiFi adapter supplied to one of the two USB ports on the device The Wi Fi Configuration window pops up and it performs a Wi Fi scan showing all networks detected The WiFi icon will appear at the top of i 5 WiFi 5 GHz ...

Page 305: ...allation Press Add Channel Plan and select the WiFi 5GHz channel plan 6 To start monitoring first select tuning mode wether to tune by access point AP or channel CH using the F1 Tuning menu enabled tuning mode is shown on joytstick icon 7 For more details about WiFi Monitoring refer to WIFI MONITORING on page 181 Description The 2 6 GHz LTE option expands the spectrum analyzer to the band 7 of LTE...

Page 306: ...ich makes it more robust DAB receivers are not compatible with DAB receivers ETI Ensemble Transport Interface is the output stream for a DAB DAB multiplexer The ETI is divided in several layers with information about the radio signal It is similar to the transport stream obtained when multiplexing a TV signal The DAB ADVANCED option has some exclusive tools such as the ETI record and the IQ signal...

Page 307: ...o and images FIC CBER CBER for FIC Fast Information Channel It is part of ETI containing information about the configuration of the ETI itself such as number and type of services CBER Bit error ratio for DAB DAB channel it includes all the ETI content FIB Ratio FIC quality ratio It is calculated from wrong packets detected by CRC 100 is the top quality level Joystick Functions Joystick up down Cha...

Page 308: ...Chapter ii ADVANCED DAB DAB OPTION 296 October 2021 Measurement Mode Screens Figure 177 Measurement 1 3 Figure 178 Measurement 2 3 ...

Page 309: ...channel frequency Function Keys F1 Tuning Tuning options F2 DAB DAB detected parameters F3 Tools Tools enabled for DAB F4 Advanced Spectrum Analyzer advanced options Status Bar It shows if the ETI is locked or unlocked If it is locked then it shows the TII Transmitter Identification Information that is received with more power It also shows the transmitter main identifier M and sub identifier S ii...

Page 310: ...Chapter ii ADVANCED DAB DAB OPTION 298 October 2021 Spectrum Analyzer Mode Screen Figure 180 Spectrum 1 3 Figure 181 Spectrum 2 3 ...

Page 311: ...AB DAB 3 3 Ensemble Country ID Service Extended Country Code ECC Content Programme Type PTY Component Category SubChannel ID Format Protection Level Bitrate Audio Language Radiotext Joystick Functions Joystick up down Change of service Joystick right left Change of channel frequency ii 3 3 DAB Mode ...

Page 312: ...ols enabled for DAB F4 Advanced Spectrum Analyzer advanced options Status Bar It shows if the ETI is locked or unlocked If it is locked then it shows the TII Transmitter Identification Information that is received with more power It also shows the transmitter main identifier M and sub identifier S DAB Mode Screens Figure 183 DAB 1 3 ...

Page 313: ...October 2021 301 Chapter ii ADVANCED DAB DAB OPTION Figure 184 DAB 2 3 Figure 185 DAB 1 3 Pressing on the key you access the Tools menu Tools that are not compatible with DAB DAB are disabled ii 4 Tools ...

Page 314: ... DAB DAB All the other tools are explained in Tools chapter TOOLS on page 93 The tool DAB ETI Recordings records an ETI ensemble transport interface The ETI contains all services inside the channel Record can be played afterwards Scren Description Figure 186 1 Selected installation date and time 2 Images send by the service slideshow The DAB DAB service can transmit still images to complement audi...

Page 315: ...bout the recording file It shows file duration maximum bitrate source and available space Joystick Functions Joystick up down Enter File selection Joystick right left Enter Control keys Function Keys F1 Exit It quits the tool F2 Erase File It removes the selected file F3 Export to USB It exports the selected file to a USB pendrive F4 Advanced It allows to select a channel service The DAB IQ Record...

Page 316: ...iles It shows name size and creation date It only shows files in the selected location internal memory or USB 8 Information window about the recording file It shows file duration maximum bitrate source and available space Joystick Functions Joystick up down Enter File selection Joystick right left Enter Control keys Function keys F1 Exit It quits the tool F4 Advanced It exports the file to a USB T...

Page 317: ...nsmitter Identification label see next 4 Softkeys 5 From left to right USB when connected selected band battery level 6 PRS symbol spectrum green and null yellow Using the Advanced menu you can display each one separately It also allows you to select the display of the null symbol with or without transmitter information 7 It shows if the TSI is locked or unlocked If it is locked it shows the trans...

Page 318: ...ow All It shows the PRS and null symbols PRS symbol It shows only the PRS symbol Null symbol It shows only the null symbol Null symbol With TII With transmitters info Without TII Without transmitters info The constellation diagram is a graphic representation of the digital symbols received over a period of time It shows in different colours the density of hits and includes features to zoom move an...

Page 319: ... permanent Zoom It allows the user to select a quarter I II III or IV where apply the zoom in To come back to normal view select All Start Carrier Stop Carrier This option allows selecting the range of carriers to be displayed between the first and last Clear This option clears all symbols in the whole constellation window For more details refer to Constellation on page 94 The Echoes function show...

Page 320: ...tween the Echoes EC mode and the Channel Frequency CH FR mode Advanced Menu Zoom The ZOOM option changes the zoom on the echoes windows Zooms are 1x 2x 4x and 8x For more details refer to Echoes on page 100 The MER by Carrier function analyses continuously the measure of the MER value for each one of the carriers forming the selected channel and they are displayed in a graphic on screen MER by Car...

Page 321: ...s power and other parameters over time All this data can be visualized in the meter or downloaded to a PC and exported to a file for later analysis Specific mesurements for DAB DAB MSC CBER FIC CBER CBER FIB Ratio are also saved For more details refer to Signal Monitoring on page 112 The Signal Coverage function allows the user to check signal for a tuned signal or a channel plan several channels ...

Page 322: ...Chapter ii ADVANCED DAB DAB OPTION 310 October 2021 Specific measurements for DAB DAB MSC CBER FIC CBER CBER FIB Ratio are also saved For more details refer to Signal Coverage on page 120 ...

Page 323: ... source signal and terrestrial band in Settings 3 Select the tuning mode by frequency or by channel To tune by channel select previously a channel plan that contains FM channels 4 To detect automatically the signal to demodulate press F2 and enable the StealthID function otherwise select the FM signal type 5 Select a FM channel or frequency and wait to lock the signal to measure 6 Press the measur...

Page 324: ...eived tuned frequency L Dev Frequency deviation caused only by L channel once decoded R Dev Frequency deviation caused only by R channel once decoded RDS Dev Frequency deviation caused only by RDS subcarrier Pilot Dev Frequency deviation caused only by stereo pilot 19 kHz tone component of MPX MPX Dev Deviation of whole band pass filtered MPX Joystick functions Joystick up down Change of main meas...

Page 325: ... Left channel level R LVL Right channel level L R LVL L R component level left right also known as mono for MPX L R LVL L R component level left right also known as stereo for MPX The maximum level reached appears as a vertical red line and the minimum level as a vertical blue line The selected parameter appears with a yellow background Numerical values for level maximum and minimum are below the ...

Page 326: ... Press the key to access the Tools menu Tools not compatible with FM signals are disabled The Advanced FM option has some exclusive tools for FM FM MPX Spectrum FM Histogram All the other tools are explained in Tools chapter TOOLS on page 93 The FM MPX Spectrum tool shows the FM multiplex spectrum in a frequency span of 100 kHz It shows all the subcarriers that form the FM multiplex It gives a gen...

Page 327: ...ultiplex with all the subcarriers Function Keys F1 Tuning Tuning options F2 FM FM demodulation parameters The FM Histogram shows a graph with the distribution of MPX FM deviation measurements Screen Description Figure 195 1 MPX Measurements Level FM signal level MPX FM Multiplex level dBr dB relative to reference level Dev Frequency deviation of whole band pass filtered MPX Hold Period of time tak...

Page 328: ... Tools available for FM F4 Advanced Advanced Menu Advanced Menu Samples Hold All It takes samples continuously Time It takes samples for a period of time Time Select the period of time to take samples Standard All samples Histogram calculated according to the ITU R SM 1268 4 standard It accumulates all values of frequency deviation into the histogram Max 50 ms Histogram calculated according to the...

Page 329: ...time The position where all these measurements are taken is determined by a GPS receiver When the equipment locks a GPS signal it automatically sets date and time using the GPS signal As long as the GPS is locked date and time is updated every hour All this data measurements and GPS position can be downloaded to a PC and exported to a file for later analysis Specific measurements for FM FM Level M...

Page 330: ...ters selected by the user Historical Monitoring It shows data from monitoring and they can also be exported Installations Management It manages installation files and creates channel plans Task Management It allows the user to schedule some tasks Specific measurement for advanced FM like different types of signal level L R L R L R level and deviation for multiplex FM and others are shown on the me...

Page 331: ...October 2021 319 Chapter iii ADVANCED FM OPTION Figure 197 Monitoring advanced FM parameters For more details refer to WEBCONTROL on page 213 ...

Page 332: ...ption Frequency enter your frequency or move left right along the frequency band 6 If you have a reference signal of 10 MHz you should connect it to the 1PPS input 7 When connecting the external reference signal it should appear on screen this message Tuning external reference If it is successfully tuned it will appear on screen the Ext Ref icon on the top right corner 8 Press the key to access th...

Page 333: ...the marker is pointing MHz Level Power level at the frequency where the marker is pointing ΔF Frequency difference between marker and cursor ΔL Power level difference between marker and cursor 4 Marker Joystick functions Joystick up down It changes reference level Joystick left right press to change mode MK Move marker SP Change SPAN FR or CH Move cursor to change frequency or channel ...

Page 334: ...USB WiFi Adapter Aero SMA H BNC M adapter F adapters F f BNC f adapter F f DIN f adapter F f F f adapter 4V RCA Jack Cable USB A USB A cable Quick Start Guide The RANGER Neo RACK is powered to the mains via the mains cord Ensure that your mains voltage is compatible v 1 Introduction v 2 Package Content only available for RANGER Neo 3 and RANGER Neo 4 NOTE Keep the original packaging since it is sp...

Page 335: ...reen appears and also a progress bar that indicates the system is loading At the top left corner it shows the equipment model and release 3 After the system loads it shows the last status used mode and screen Switching Off 1 Press the ON OFF switch at the back of the equipment Figure 199 Front View v 4 Equipment Details ...

Page 336: ...Chapter v RACK OPTION 324 October 2021 Figure 200 Side View Figure 201 Back View ...

Page 337: ...0 MT0170 Antenna Dual WiFi 1x 0 MF0213 USB WiFi adapter 1x 0MF0214 USB cable 1x 0 CO6861 Aero SMA H BNC M adapter 1x ___ for RANGER Neo 3 and RANGER Neo 4 GPS receiver 1x CC 046 Jack 4V RCA cable 1x AL 103 External DC charger 1x AD 055 F f BNC f adapter 1x AD 056 F f DIN f adapter 1x AD 057 F f F f adapter 1x CA 005 Mains cord 1x DG0234 Quick Reference Guide NOTE All other specifications are equal...

Page 338: ...ser manuals ranger neo 3 high class field strength meter and spectrum analyzer DiSEqC Commands Description of DiSEqC commands for remote control of antennas http www promaxelectronics com ing downloads user manuals ranger neo 3 high class field strength meter and spectrum analyzer Remote Control Commands Description of remote commands for remote control of the meter http www promaxelectronics com ...

Page 339: ...outu be FDdDTDVqN5E 2 Setting Up How to point a rotor driven antenna https youtu be bAZuNhJ5aL8 t 826 3 Settings and Preferences Settings menu https youtu be LACzovzAn4E 3 Settings and Preferences Preferences menu https youtu be M0aEnmF3sVM 4 RF Signal Tuning Manual input of frequencies https youtu be 81l5ezO4cgg 4 RF Signal Tuning Measuring and decoding DVB S2 multi stream https youtu be xuv9ESed...

Page 340: ...UAIIms 5 Tools Echoes analyser https youtu be f2SKJJ3B6KI 5 Tools MER by carrier https youtu be J1lTkl5uNlo 5 Tools MEROGRAM https youtu be orGLVeYzDO4 5 Tools Spectrogram https youtu be eQpUUN3OtUM 5 Tools Attenuation test https youtu be h7Y5SuZ5nWM 5 Tools Signal monitoring https youtu be yRM4JrblZCI 5 Tools Signal coverage 1 2 GPS https youtu be Xh7s7sDujM 5 Tools Signal coverage 2 2 KML genera...

Page 341: ...s Management Installations management https youtu be TUuHJBX0BQI 9 Installations Management Sending files by e mail https youtu be aIzvhn1xWe0 10 webControl webControl introduction https youtu be YV1MicKpSN0 10 webControl File manager https youtu be RAhiw04P2h8 10 webControl Report generator https youtu be _EFG1LmwqCQ 10 webControl Channel plan creator and editor https youtu be 0Zg1dg7xZXg 10 webC...

Page 342: ... be i5O e5qOsDA 11 Connecting to external devices How to create channel plans using NetUpdate4 https youtu be YwbpfRNGJYI 11 Connecting to external devices How to generate a measurement report with Update4 https youtu be fQP8n 59pHc Annex i Optical fiber https youtu be 7OiEijjRZ64 Annex ii Advanced DAB https youtu be kBv_3ToWdQs Annex iii Advanced FM https youtu be 23I6dyyYbh8 Chapter Title Link Q...

Page 343: ...e 50 battery charge 4 Battery time charge 5 Beacon signal 83 Bitrate Analyzer 159 Brightness 47 50 CAM module 260 CCTV 44 Center Frequency 52 59 Center Tuned Frequency 59 Centre Frequency 76 Channel Plan 58 Channel Plan Adding 209 Color System 51 Colour System 48 Common Interface 260 Constellation 94 Cursor 75 DAB DAB 86 DAB advanced 294 Dashed BW 67 Database Services 52 Datalogger 130 Datalogger ...

Page 344: ...3D map 129 GPS Signal Receiver 250 HDMI Port 255 High Frequency option 320 Icons 17 Importing data from USB 211 Information additional 326 Input Impedance 52 Input Jack Connector 255 Installation creation 210 Installation data export 248 Installation edition 210 Installation export from USB 211 Installation export to USB 211 Installation import 250 Installation complete export 249 Installation exp...

Page 345: ...s Test 97 LTE medición de señales 91 Marker 65 76 Marker Trace 66 Max Hold 66 Measurement Mode Screens 69 Menu Tree 18 MER by carrier 102 MEROGRAM 104 Min Hold 66 Minimal FM Level 52 Minimal Satellital Power 52 Minimal Terrestrial Level 52 Minimal Terrestrial Power 51 Mode keys 39 Netupdate connection 252 Netupdate conexión 253 Network Delay Margin 65 170 Network Options 54 NTP Options 55 NTSC 48 ...

Page 346: ... Sat Band High Low 47 SatCR commands 257 Satellite Band 51 Satellite Identification 83 Satellite Units 51 Scan 177 SCD EN50494 46 SCD EN50494 commands 257 SCD2 EN50607 commands 258 SCD2 EN50607 46 Screen and Data Capture 139 Screen cleaning 279 Screenshot 38 Screenshot viewer 209 SECAM 48 Security Options 53 Service Recording 173 Service Selection 63 Settings 38 Settings Menu 43 SFTP conexión 254 ...

Page 347: ...Tilt 175 Time Date 51 Time settings 55 Tone Level 65 Tools 63 Touch Screen 26 Touchscreen Calibration 51 Transport Stream Alarms 161 Transport Stream Analyzer 155 Transport Stream Recording 167 TS Data 67 TS ASI Port 262 Tuned Audio Information 80 Tuned service information 79 Tuning by Channel 58 tuning by frequency 58 TV Radio Mode Screens 77 USB Flash Drive 248 USB WiFi adapter dongle 250 USB ho...

Page 348: ...ettings 214 WebControl TV Parameters 219 Webcontrol channel plan 223 Webcontrol Mask Monitoring 237 Webcontrol password 215 Webcontrol Password Recovery 216 Webcontrol Remote Access 215 Webcontrol service TS Record 221 Webcontrol Task Management 234 WiFi Access Points 186 WiFi Operation 181 WiFi Site Survey 186 WiFi Spectrum 183 ...

Page 349: ...ncesc Moragas 71 08907 L Hospitalet de Llobregat Barcelona Spain Phone 93 184 77 00 International 34 93 184 77 02 e mail promax promaxelectronics com www promaxelectronics com PROMAX TEST MEASUREMENT S L U ...

Reviews: