PGA-710 Autoanalysis System – How To Measure Guide
19
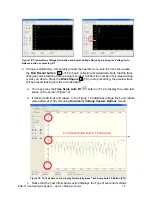
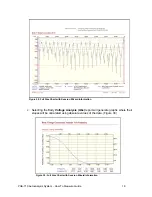
Figure 31: Body Voltage Generation Probability Curve using Recorded Negative (-) data.
The slope is from Right (High magnitude) to Left (Lowest magnitude)
d.
Selecting the
Body Voltage Analysis
report will generate graphs where slopes will
be calculated using values and
polarities
of the recorded data. (Figure 31)
e.
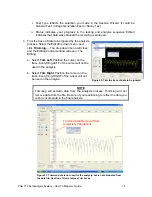
The first page of the report includes the graphic recording of the data, session
information and general calculations.
Graph of Recorded Data
±3 Sigma Ranges Highlighted
Descriptive Information that was
input to the Session Wizard
General Calculations and Footer
Information, which includes File
Name, Time and Date document
was printed, and page numbers
Figure 32: First Page of Body


