93-520-20 Issue 3.3
Page 47 of 60
CirrusPro Engineer’s Manual
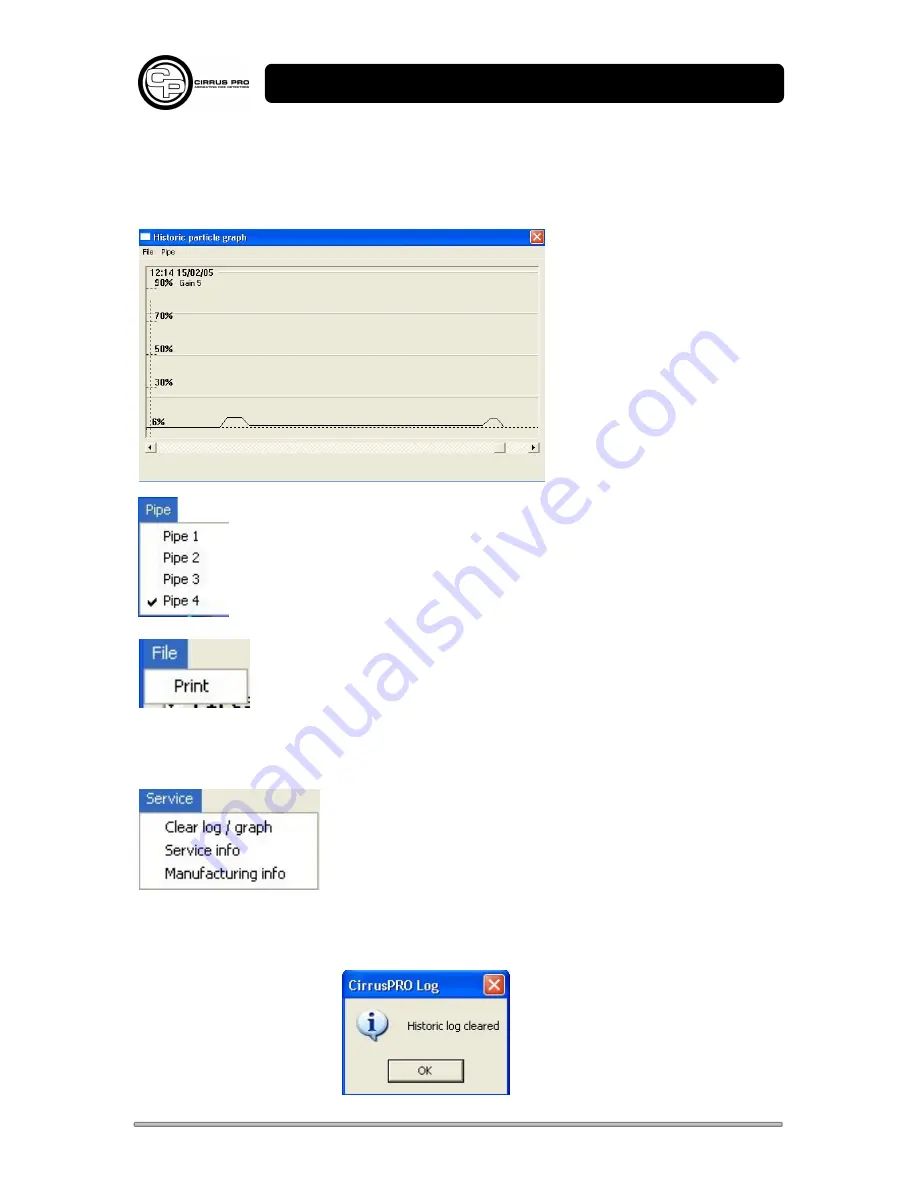
4.2.4 Historic Graph
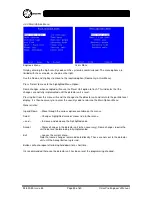
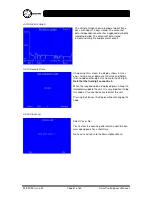
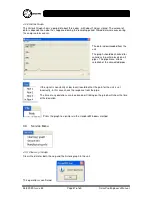
The Historic Graph shows a period of about three days, with about 10 days stored. The amount of
data is dependent on what has happened during the recording period. Stored data increases during
fire and pre alarm events.
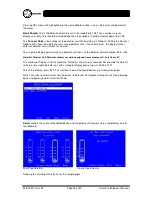
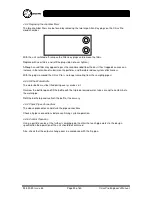
The data is downloaded from the
unit.
The graph should be checked for
variations in particle levels on all
pipes. The pipe menu allows
selection of the connected pipes.
If the signal is constantly at low level it could be that the gain for the unit is set
incorrectly. In this case check the response from the pipe.
The time of any deviations can be observed. Clicking on the graph will show the time
of the deviation.
Prints the graph to a printer via the standard Windows method.
4.3
Service Menu
4.3.1 Clear Log / Graph
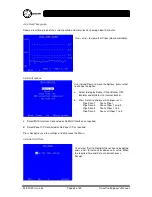
Clears the data for both the Log and the historic graph in the unit.
This operation is confirmed:

