Section 8
Measuring Flow Rate
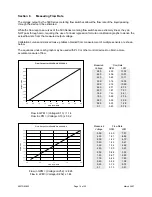
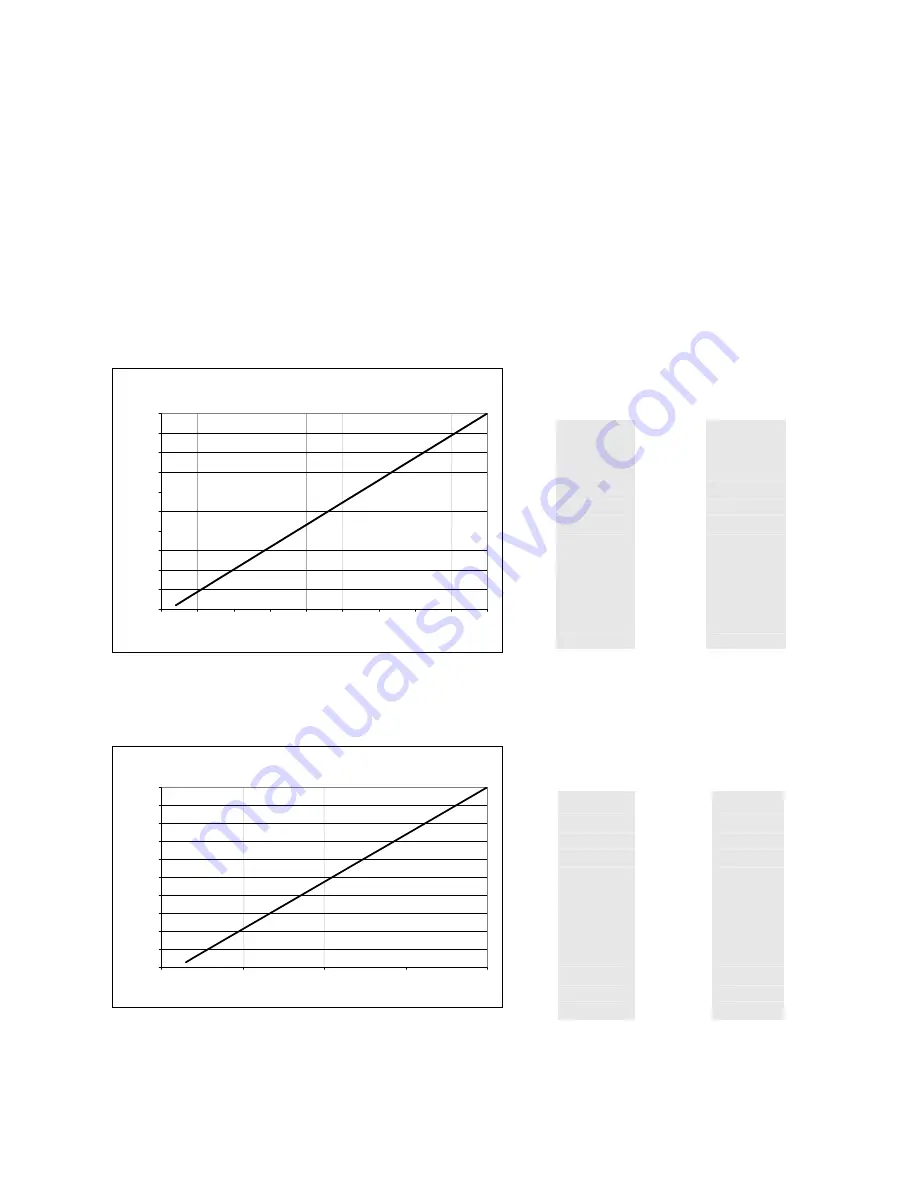
The voltage output by the 500 Series metering flow switches allows the flow rate of the liquid passing
through the device to be estimated.
While the flow response curves of the 500 Series metering flow switches are extremely linear, they do
NOT pass through zero, requiring the use of a linear regression formula or calibration graphs to derive the
actual flow rate from the measured output voltage.
Calibration curves and derived look-up tables obtained from measurement of multiple sensors are shown
below.
The equations under each graph may be used with PLC or other control devices to obtain a more
accurate measure of flow.
Flow Output for 0504SN4 & 0504SA4
0.00
0.50
1.00
1.50
2.00
2.50
3.00
3.50
4.00
4.50
5.00
0.0
0.5
1.0
1.5
2.0
2.5
3.0
3.5
4.0
4.5
Flow Rate - GPM
Output - VDC
Flow in GPM = (0.13) / 1.14
Flow in LPM = (0.13) x 3.32
F lo w O utp u t fo r 05 04S N 2 & 05 04S A 2
0 .0 0
0 .5 0
1 .0 0
1 .5 0
2 .0 0
2 .5 0
3 .0 0
3 .5 0
4 .0 0
4 .5 0
5 .0 0
0 .0
0 .5
1 .0
1 .5
F lo w R a te - G P M
Output - V
D
C
500TRM-002
Page 16 of 22
March 2007
2 .0
Flow in GPM = (0.252) / 2.626
Flow in LPM = (0.252) x 1.44
Measured Flow
Rate
Voltage GPM LPM
5.00 4.50 17.03
4.50 4.06 15.37
4.00 3.62 13.71
3.50 3.18 12.05
3.00 2.74 10.39
2.50 2.31 8.73
2.00 1.87 7.07
1.50 1.43 5.41
1.00 0.99 3.75
0.50 0.55 2.09
0.25 0.33 1.26
0.1 0.20 0.76
Measured Flow
Rate
Voltage GPM LPM
5.00 2.00 7.57
4.50 1.81 6.85
4.00 1.62 6.13
3.50 1.43 5.41
3.00 1.24 4.69
2.50 1.05 3.97
2.00 0.86 3.25
1.50 0.67 2.53
1.00 0.48 1.80
0.50 0.29 1.08
0.25 0.19 0.72
0.1 0.13
0.51

