

5 – Managing Ports
Graphing Port Performance
5-24
59056-03 C
A
5.6.7.1
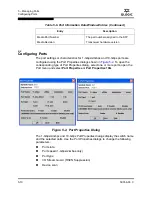
Displaying Graphs for a Stack
Graphs can be displayed for all ports on all switches in a stack or for only those
ports on all switches that are logged in. To display graphs for a stack of switches,
do the following:
1.
In the left-pane/fabric tree, right-click on a Stack icon.
2.
In the popup menu, select
Open Graph For All Ports on Stack
or
Open
Graph For All Logged-In Ports on Stack
.
5.6.7.2
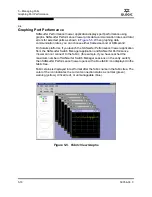
Arranging Graphs in the Display
To arrange and size graphs in the display, open the Window menu and select
Cascade
,
Tile
, or
Close All
.
Cascade
overlaps the graphs so that all graphs are at least partially visible.
Tile
arranges the graphs in non-overlapping rows and columns.
Close All
closes all graphs.
You can also click a graph on the Window menu to bring that graph to the front.
Summary of Contents for SANbox 5200 Series
Page 48: ...2 Using SANsurfer Switch Manager Using the Faceplate Display 2 30 59056 03 C A Notes...
Page 152: ...4 Managing Switches Displaying Hardware Status 4 46 59056 03 C A Notes...
Page 180: ...5 Managing Ports Graphing Port Performance 5 28 59056 03 C A...
Page 318: ...A Command Line Interface Zoning Command A 138 59056 03 C A Notes...