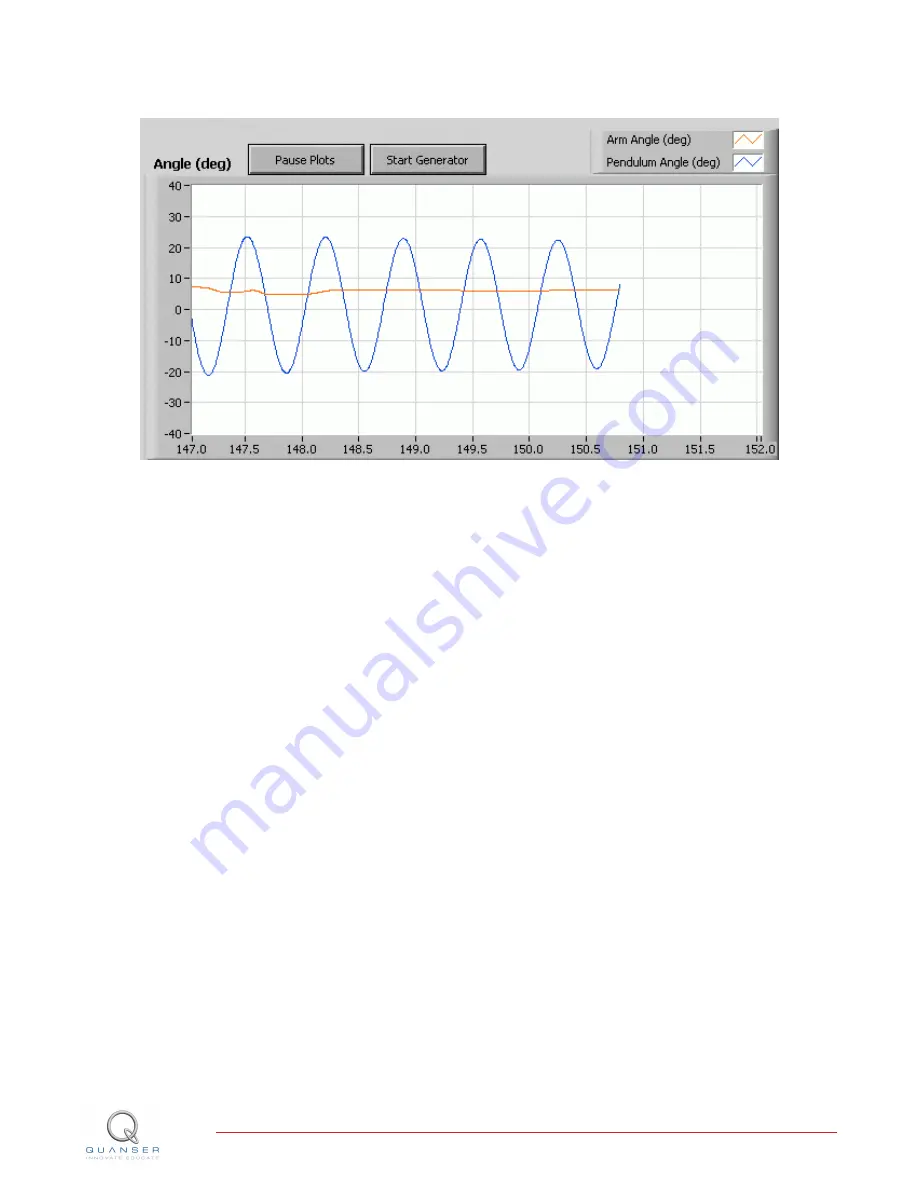
2. The resulting scope is depicted in Figure 7.12. The blue trace is now more visible.
Figure 7.12: Y-axis of scope has been adjusted
Similarly, the minimum range of the y-axis can be changed as well as the range of the x-axis. For example, to see
a time range of 10 seconds instead of 5 seconds the x-axis range can be changed from [0.0, 5.0] to [0.0, 10.0].
However, when changing the x -axis, i.e. the time-scale, it is recommended to do the following:
1. Pause the scopes or stop the VI and clear the chart (right-click on scope, select Data Operation
∥
Clear Chart).
2. Apply the same scale change to both the output and input scopes. Otherwise, the data plotted in each scope
will not be synchronized with each other.
7.2 SAVING RESPONSE
Read the following to save a scope response:
1. Right-click on the scope and select Export Simplified Image, as shown in Figure 7.13
QNET MYOELECTRIC- User Manual
v 1.0


