Bit Error Rate Tester | BERT 1005
Quantifi Photonics Ltd.
Version
2.04
49
8.3.9.3
Eye scan status
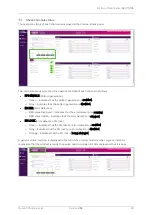
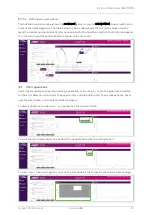
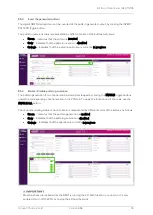
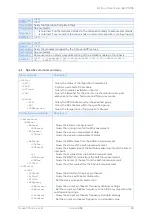
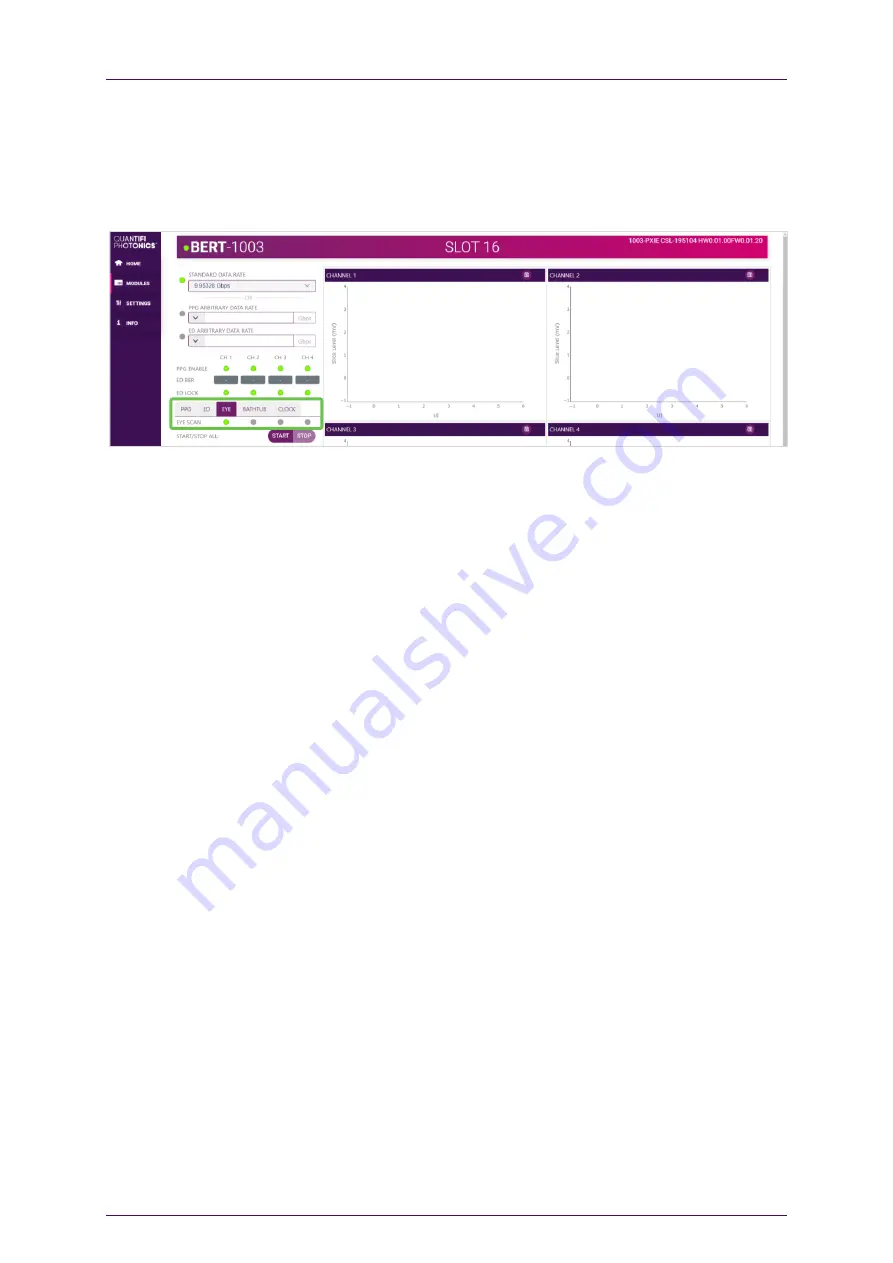
The eye scan status of each channel is represented by indicators in the EYE tab as follows:
•
Green
–
Indicates that the eye scan operation has been completed successfully.
•
Gray
–
Indicates that the eye scan operation is not started or has been stopped.
•
Orange
–
Indicates that the operation is currently in progress.
8.3.10
Bathtub scan
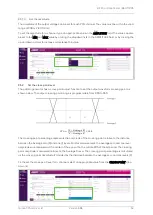
The bathtub scan is used to measure the jitter of a data signal. The horizontal axis of the bathtub
represents the clock phase alignment of the error detector to the received bit, and the vertical axis
represents the bit error rate at a set voltage decision point. The bathtub plot is a one-dimensional
representation of the information taken from a horizontal slice of an eye diagram. The bit error rate
decreases as you move into the center of the eye, which gives the bathtub plot its distinctive shape.
A bathtub scan starts by measuring the BER at sampling points outside the eye width, on both the left
and the right sides of the eye. The clock phase alignment is then increased for the left side of the plot or
decreased for the right side of the plot so that the scan progresses towards the center of the eye.
The BER will continue to be measured at each point until the number of errors drops below a set value.
When the measured number of errors fails to meet this threshold, the BERT will dynamically increase
the time spent at that point to accurately measure the BER for the set sampling point. An estimated
time is given for the measurement of the next data point, which may reset if the number of errors is less
than the threshold at the end of the wait time.
Due to the long waiting time associated with low values of BER, the bathtub scan provides extrapolation
of the BER values. This allows users to easily determine the total jitter at BER levels associated with J2,
J9 and J12.
The terms J2, J9, and J12 are terms defined by the IEEE 802.3 standards referring to the various
portions of jitter that are comprised of a systems total jitter.
•
J2
–
The time interval that contains all but 10^(-2) bit error rate of the total jitter. Contains most of
the jitter due to the inter-symbol interference (also referred to as Data Dependent Jitter or DDJ).
•
J9
–
Indicates the time interval of the outer one-billionth of the distribution, from BER = 2.5 x 10^(-10)
and lower. J9 is dominated by the Gaussian tails of the random jitter distribution.
•
J12
–
A common pass/fail point for an error rate in BER = 2.5 x 10^(-13)
and lower.
The well-known Dual Dirac jitter model has been used to decompose the total jitter into deterministic
jitter and random jitter.


