Bit Error Rate Tester | BERT 1005
Quantifi Photonics Ltd.
Version
2.04
51
8.3.10.4
Bathtub scan plot window
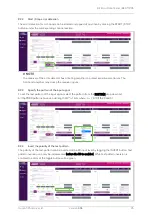
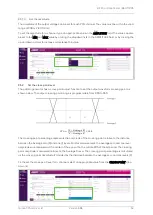
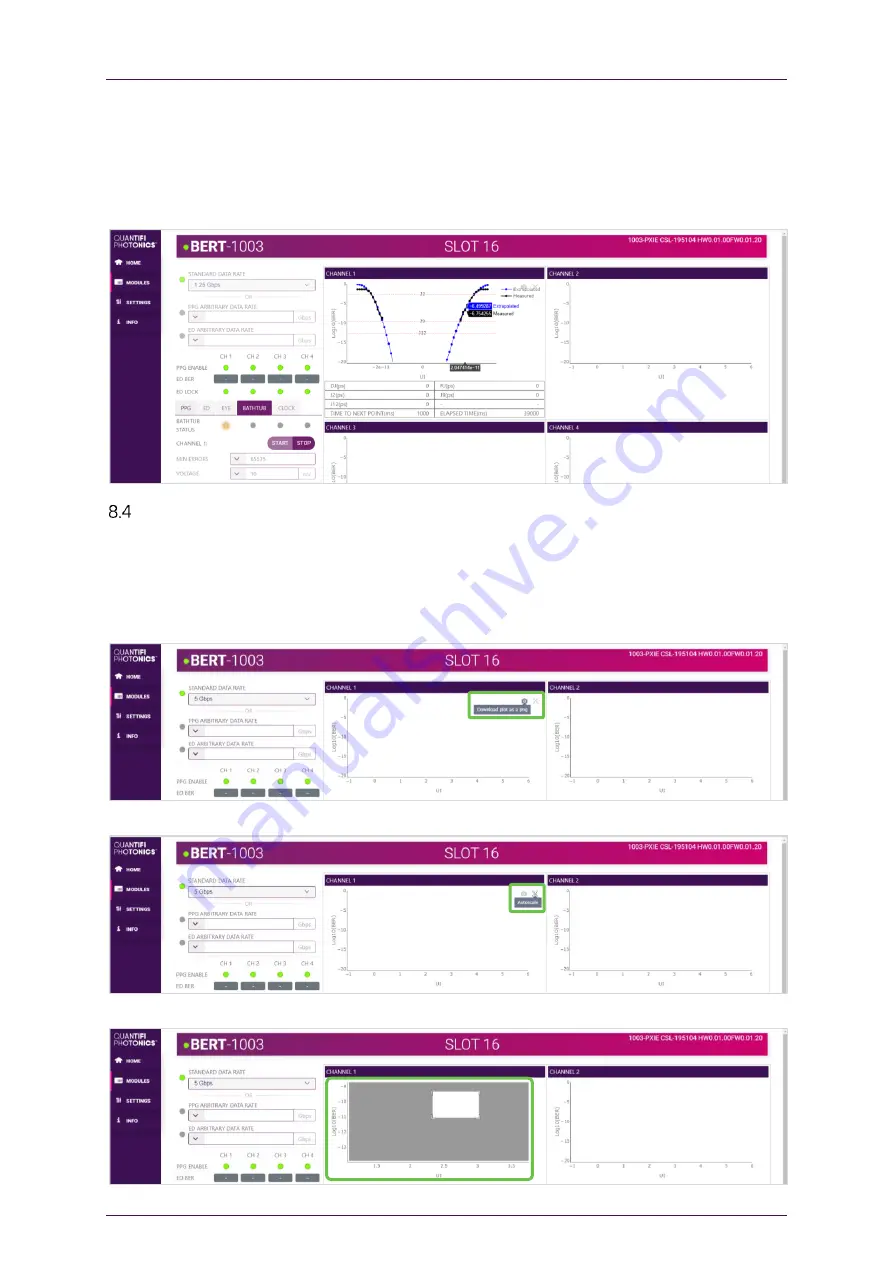
The bathtub scan plot window shows the measured (black curve) and extrapolated (blue curve) bit error
rates at each sampling point. The table below the plot window shows the total jitter values at each J
level, the random and deterministic jitter as calculated by the Dual Dirac method, the total time elapsed
to run the scan, and the estimated time to measure the next point.
Chart operations
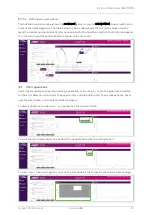
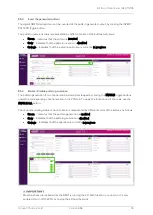
Useful functionalities such as downloading screenshots or zooming in / out on the graph are available
for the error detection strip charts, the eye scan plot, and the bathtub plot. To see these options, hover
over the plot window, and a toolbar will be displayed.
To download the plot window as a
.png
image click the camera button.
To scale the plot automatically to include all the viewable data click the scaling button.
To zoom in/out, click and drag the cursor on the plot. Double-click to reset to the default zoom settings.

