Section IV - Operating Procedures
Trending -
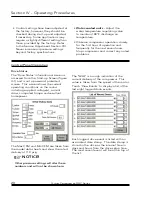
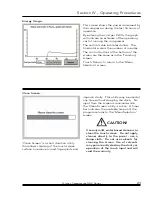
The trending screen is a graphical display
of the compressor operation over the
previous 6 hours (samples taken every
minute).
The lines indicate pressure (dark, solid
line), temperature (dark, solid line), and
calculated horsepower (gray, broken line)
and are plotted from right to left (leftmost
values being most recent).
The scale on the left indicates the plotted
value and the scale along the bottom, is
the sample number.
The control buttons allow the graph to be
viewed in varying frames (from all 6 hours
at one time to expanded sections that may
be scrolled left or right).
> <
Compress the scale (increase the
number of points displayed)
< >
Expand the scale (decrease the
number of points displayed)
< & > Scroll through the graph to the
desired section
< <
Return the graph to the extreme left
(most recent) point
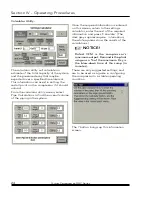
Touch ‘Return’ to return to the ‘Menu
Selection’ screen.
temperature
pressure
horsepower
22
Quincy Compressor-QGV Series
Summary of Contents for QGV-100
Page 2: ......
Page 6: ......
Page 17: ...Section II Description This page intentionally left blank Quincy Compressor QGV Series 11 ...
Page 74: ...Appendix A Dimensional Drawings QGV 50 air cooled 68 Quincy Compressor QGV Series ...
Page 75: ...Appendix A Dimensional Drawings QGV 50 water cooled Quincy Compressor QGV Series 69 ...
Page 76: ...Appendix A Dimensional Drawings QGV 75 100 air cooled 70 Quincy Compressor QGV Series ...
Page 77: ...Appendix A Dimensional Drawings QGV 75 100 water cooled Quincy Compressor QGV Series 71 ...
Page 78: ...Appendix A Dimensional Drawings QGV 150 200 air cooled 72 Quincy Compressor QGV Series ...
Page 79: ...Appendix A Dimensional Drawings QGV 150 200 water cooled Quincy Compressor QGV Series 73 ...
Page 89: ......

