background image

St ep 4.2: C heck reflect ion diagram s

The reflection diagram for each sensor can be accessed via the sensor configuration page by
clicking on the corresponding "reflection" button (Fig. 3.7).

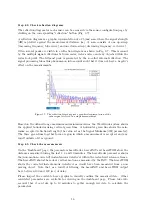
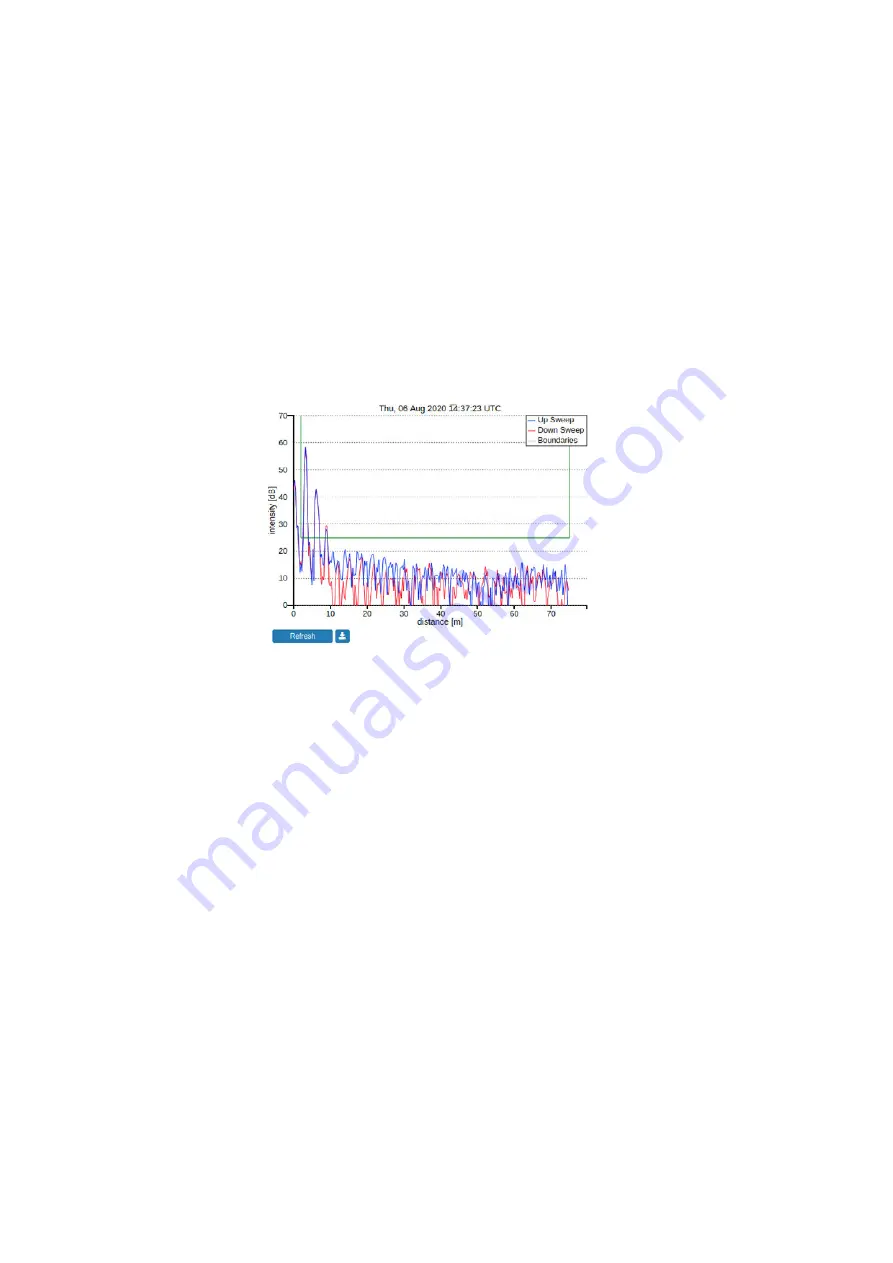
A reflection diagram is a graphic representation of a 25 [ms] scan, where the signal strength
[dB] is plotted against the measurement distance [m]. A scan consists of one up-sweep
(increasing frequency, blue curve) and one down-sweep (decreasing frequency, red curve).

Often several peaks are visible in a reflection diagram as shown in Fig. 3.7. This is caused
by the multiple signal reflections between radar, water surface and any objects within the
radar foot-print. The leftmost peak is generated by the so called internal reflection. The
signal processing takes this phenomenon into account such that it does not have a negative
e

ect on the measurements.

Figure 3.7: The reflection diagram gives a graphical representation of the

radar signal received in a single measurement.

Based on the defined range maximum and minimum values, the WaveGuide system shows
the applied boundaries using vertical green lines. A horizontal green line shows the min-
imum accepted reflection strength (the value set as the Signal Minimum [dB] parameter).
The three green lines together form a region in which a measurement is accepted, and any
result outside of it is ignored.

St ep 4.3: C heck t he m easurem ent s

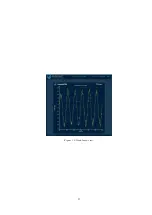
On the ’Dashboard’ page, the parameters heaveRadar, heaveIMU and heaveWOB show the
distances measured during the last 1, 3 and 10 minutes. The heaveRadar parameter shows
the (non-motion-corrected) instantaneous waterlevel within the radar-fixed reference frame.
The heaveIMU shows the radar’s vertical motion as measured by the IMU. The heaveWOB
shows the corrected instantaneous waterlevel as would have been measured from a non
moving object. Note that, as a result of filtering, the heaveIMU and heaveWOB output
have between 100 and 120 [sec] of delay.

Please inspect the available heave graphs to visually confirm the measured data. Other
calculated parameters are available for viewing on the dashboard page. Please take into
account that it can take up to 10 minutes to gather enough raw data to calculate the
parameters.

16

Summary of Contents for WaveGuide 5 Onboard 2

Page 1: ...WaveGuide Onboard 2 User Manual...

Page 2: ...Version 5 2 1 1 4th of Nov 2020 Applicable for product number WG5 OB2 CP Related to software version WB2 5 2 1 Radac B V Elektronicaweg 16b 2628 XG Delft The Netherlands tel 31 0 15 890 3203 e mail in...

Page 3: ...of the local requirements and regulations for installation of electronic equipment The information in this installation guide is the copyright property of Radac BV the Netehrlands Radac BV disclaims...

Page 4: ...guration 11 Step 3 1 Set system date and time 11 Step 3 2 Adjust network settings 12 Step 3 3 Sensor configuration 12 Step 4 Perform system check 15 Step 4 1 Check system information 15 Step 4 2 Check...

Page 5: ...l and pitch Both radar and IMU sensor outputs are used to calculate the true water level heaveWOB which is then further processed to provide wave height parameters and wave spectra Warning Do not use...

Page 6: ...he approval certificate Warning In hazardous areas it is compulsory to Use personal protection and safety gear such as hard hat fire resistive overall safety shoes safety glasses and working gloves Av...

Page 7: ...some influence on the waves progressing around it Hence it is advised to mount the sensors at a position facing the mean wave direction so that they can measure the least disturbed water surface As e...

Page 8: ...positioning criteria The outside diameter of the WaveGuide radar cylinder is 219 mm and the total height of the system is 245 mm The radar cylinder has a flange 265 mm diameter that con tains 4 mount...

Page 9: ...WaveGuide system requirements for power and data transmission The terminal compartment contains a six pole and a two pole connector as well as a ground connection point as shown in Fig 2 2 The six po...

Page 10: ...D blinking modes Warning Improper wiring can damage the radar s communication board Always check that power is applied to the right connector before connecting it Warning Make sure the housing of the...

Page 11: ...rm a system check 5 Configure the distribution of data Step 1 Connect the WaveGuide system to a computer Once the WaveGuide system is connected to a Local Area Network communication can be done via th...

Page 12: ...is will cause the sensor to use the default IPV4 address 192 168 111 71 until it is rebooted allowing the user to access and change the network settings to the desired fixed configuration N ote In ord...

Page 13: ...minutes However the web browser may store the login name and password In that case the authorization data will be submitted automatically by the browser without a pop up dialog The default login passw...

Page 14: ...ly correct its system time to UTC time For the NTP service to work the system needs to be connected to the Internet as it needs to be able to reach its default NTP servers In the case that the NTP ser...

Page 15: ...he correct settings for the local network N ote To ensure an accurate system time the WaveGuide system is by default configured to use an NTP time service For this service to work a connection to the...

Page 16: ...radar to the lowest expected water level This is to avoid detecting multiple echoes of the same measurement sweep Min range The range minimum in m is the minimum distance at which the sensor will dete...

Page 17: ...After changing the sensor parameters for the radar rebooting the system is required for the changes to take e ect The reflection diagram of the sensor should be checked to ensure that the water level...

Page 18: ...arted a process that can take up to five minutes after power up the displayed status becomes OK Figure 3 6 System information In the same table the ratio between the number of performed and invalid me...

Page 19: ...nd minimum values the WaveGuide system shows the applied boundaries using vertical green lines A horizontal green line shows the min imum accepted reflection strength the value set as the Signal Minim...

Page 20: ...Figure 3 8 Dashboard view 17...

Page 21: ...lement the subscription with immediate e ect no system reboot is required D efault message format The Default format starts a new line for each parameter in the subscription The time used in the Radac...

Page 22: ...red information parameters spectrum per processing interval The chosen parameters are separated by a semicolon and the 51 spectrum values czz10 are included The NaN string is replaced with a 9999 stri...

Page 23: ...generate and download the diagnostics file and that it can contain up to 100 kB of data It is recommended to share the diagnostics file with Radac B V because it can help with providing future techni...

Page 24: ...using 20 minute data blocks The 20 minute observation block is chosen as a compromise between short enough to obtain small variance in the statistical parameters and long enough to assume it to be a...

Page 25: ...e of the log files after clicking a download button it can take up to 3 minutes for the system to compress the files and start the transfer It is also possible to access and transfer the logged data u...

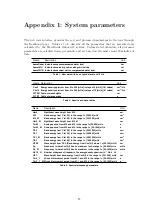
Page 26: ...e height from M0 cm M0 Band energy from Czz10 f in the range f 30 500 mHz cm2 M0_ M Band energy from Czz10 f in the range f 30 1000 mHz cm2 Hm0_ M Significant wave height from M0_ M cm T m02 Average p...

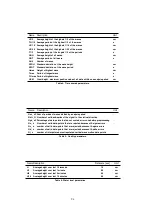
Page 27: ...Table 4 T ime domain parameters Name Description Unit Nwt_ zP Sum of periods of waves divided by analysis period Ndlr_ H Number of valid sub series of the signal in the vertical direction Ngd_ zP Perc...

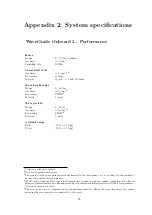
Page 28: ...h 15 to 15 deg 1 Valid for a still water surface 2 For a water surface with waves 3 The accuracy of the wave parameters is not limited by the radar sensor yet it is defined by the stochastic nature of...

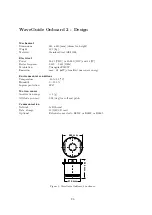
Page 29: ...ion Triangular FMCW Emission max 0 1 mW of emitted microwave energy Environmental conditions Temperature 40 to 45 oC Humidity 0 100 Ingress protection IP67 Motion sensor Acceleration range 4 g Attitud...

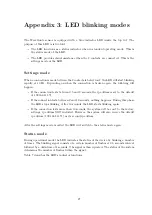
Page 30: ...92 168 111 71 If the connection lasts between 2 and 10 seconds nothing happens During this phase the LED stops blinking After 10 seconds the LED starts blinking again If the connection lasts more than...

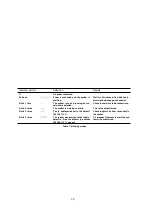
Page 31: ...rk is detected Check the network cable connections Blink 2 times T he system is working normally T his is the default mode Blink 3 times T he ip address was set to the default 192 168 111 71 Check cha...

Reviews: