O
perat
ion
11
U
SING
THE
B
AR
G
RAPH
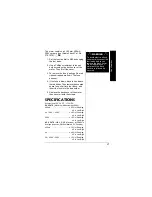
In addition to the numeric display, the meter
displays all measurements on a bar graph
which consists of 8 segments at the top of
the display.
Each segment represents a value of 500
when you measure voltage, current,
resistance and diodes.
Ô
Segments of the bar graph also appear
when the reading is above 0.8 volts for 1.5
volt C/D/AA/AAA size batteries or above 4.8
volts for 9V batteries.
One segment of the bar graph appears for
each 0.1 volt if you are measuring C, D, AA,
and AAA batteries. One segment of the bar
graph appears for each 0.6 volts, if you are
measuring 9-volt batteries. If all segments of
the bar graph appear, the battery being
measured is fresh.
Ô
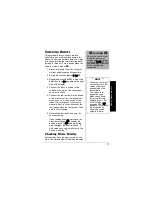
For example, if you are measuring DC
voltage and the displayed value is 2.560
volts, 6 segments appear on the bar graph.
Bar
Graph
Ô
NOTE
Ô
•
Each segment of the
bar graph represents
a unit of
measurement used
by the meter for the
function you
selected. The
segments do not
represent the actual
number of volts,
ohms, and current
measured by the
meter.
•
The bar graph
updates about 4
times per second,
providing a better
indication of levels
and trends for
different types of
measurements.


