RAK7249/58
5
RAK LoRaWAN Industrial Gateway Configuration Guide
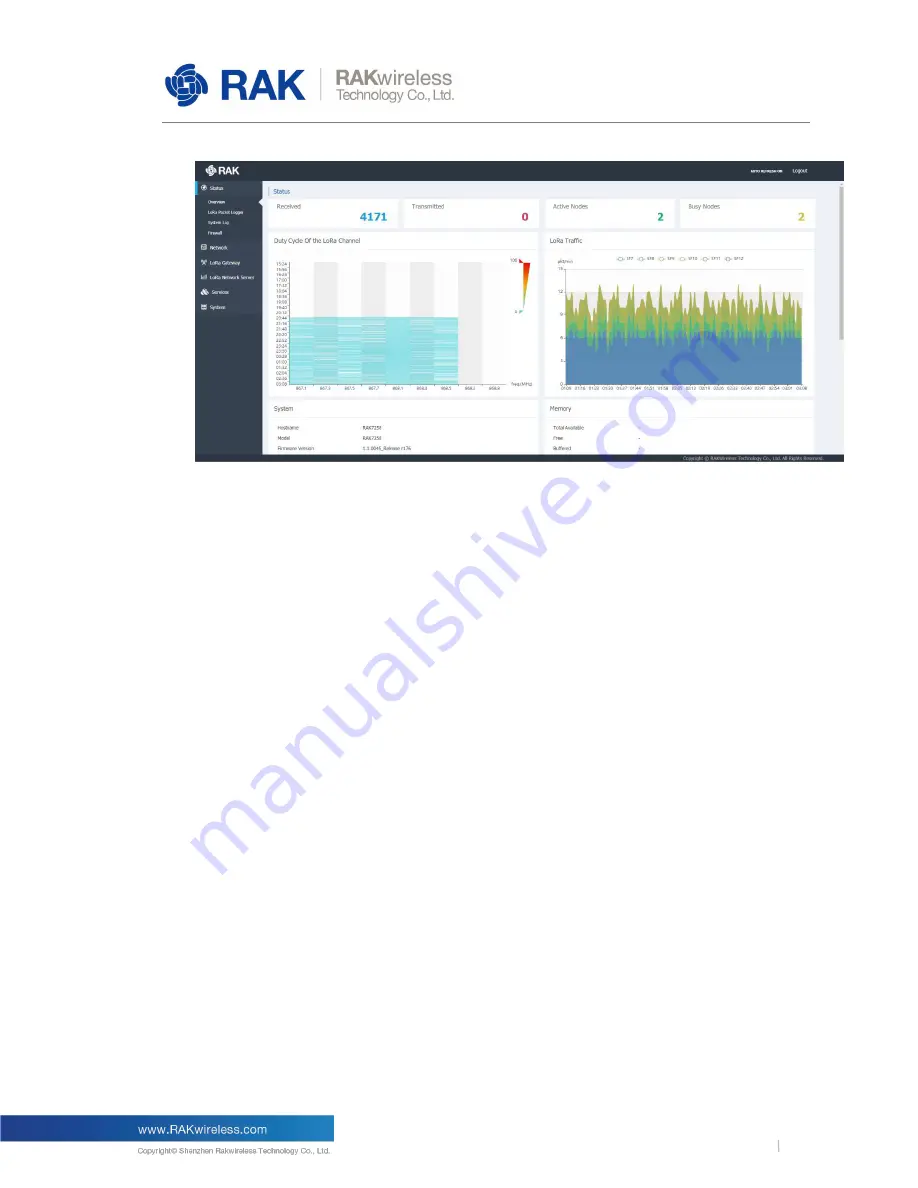
Figure 1 |
Status Overview page
Active Nodes
:
Shows the number of active LoRa nodes within the LoRa gateway coverage (those that
have sent no data for more than 10 min are discarded from the count).
Busy Nodes
:
Shows the number of busy nodes within the LoRa gateway coverage (nodes with an
average message spacing of less than 60s).
Duty Cycle of the LoRa Channel
The graph represents the Duty Cycle load by frequency channel (Data is kept for the last 12
hours). The minimum resolution along the time axis is 60s. Each value is an average over
60s. The values are color code – green to red, low to high.
LoRa Traffic
:
The graph shows the packet per minute rate as a function of time. Above the image, one
can see the color-coding of the different Spreading Factors, where the actual height of the
values is a sum of all the packets over all spreading factors for the time sample.
Additionally you have sub-windows displaying the System, Memory, LoRa Netowrk Server,
Network (WAN). Cellular, and Wi-Fi information. Those have their separate sections and will
be discussed in detail further down.
3.1.2
LoRaWAN Packet Logger
This is where a log of the LoRa messages is shown in real time. There are several options
for filtering as well as the possibility to download the statistics in a file. Additionally there is a
summary (Total, Uplink, and Downlink), below the filter fields.


