Measurements and Results
R&S
®
FSVA3000/ R&S
®
FSV3000
240
User Manual 1178.8520.02 ─ 01
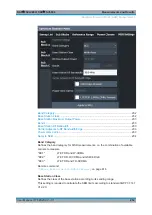
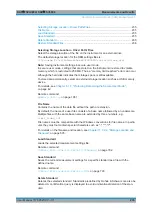
2. Select the band category that determines the digital standards used in the mea-
surement setup (see
3. Define the bandwidth that contains all relevant carrier signals to be measured.
4. For measurements with GSM/EDGE, LTE FDD and W-CDMA carriers (BC2),
define whether a GSM/EDGE or an LTE FDD carrier, or both, are located at the
edge of the bandwidth.
5. Select the "Apply to SEM" button.
The sweep list is configured according to the MSR specification, with the required
number of ranges and defined limits.
6. Start a sweep.
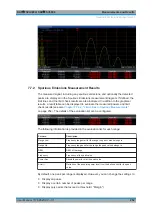
The determined powers and limit deviations for each range are indicated in the
Result Summary. If activated, the peak power levels for each range are also indica-
ted in the Spectrum diagram.
7. To save the Result Summary, export the results to a file as described in
ter 7.6.6.2, "How to Save SEM Result Files"
To perform a Multi-SEM measurement
1. Define the span of the signal to be monitored in the general span settings.
2. Select the "Multi-SEM Config" softkey.
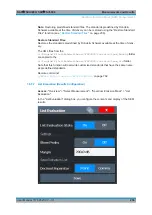
3. Define the number of sub blocks (up to 3) that contain the relevant carriers.
4. For each sub block, define the center frequency, that is, the frequency of the TX
carrier or a frequency in the dedicated reference range.
5. For each sub block, do one of the following:
● Select a standard settings file to be used.
● Select the "MSR Settings" button and define the MSR configuration as descri-
"To perform an MSR SEM measurement"
● Select the "Edit" button and configure the sweep list manually as defined in
configure a user-defined SEM measurement"
on page 238. Be sure to select
the correct vertical tab for the corresponding sub block within each subtab of
the "Spectrum Emission Mask" configuration dialog.
Define a function to be used for overlapping ranges in the "Multi-Limit Calc"
field of the sweep list.
6. Start a sweep.
The determined powers and limit deviations for each sub block, each gap, and
each range are indicated in the Result Summary. If activated, the peak power lev-
els for each range are also indicated in the Spectrum diagram.
7. To save the Result Summary, export the results to a file as described in
ter 7.6.6.2, "How to Save SEM Result Files"
Spectrum Emission Mask (SEM) Measurement

