Measurements and Results
R&S
®
FSVA3000/ R&S
®
FSV3000
273
User Manual 1178.8520.02 ─ 01
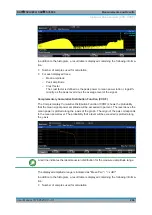
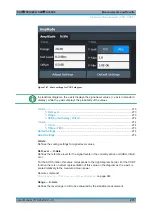
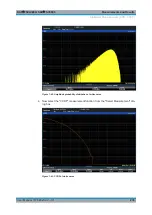
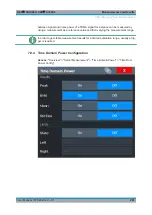
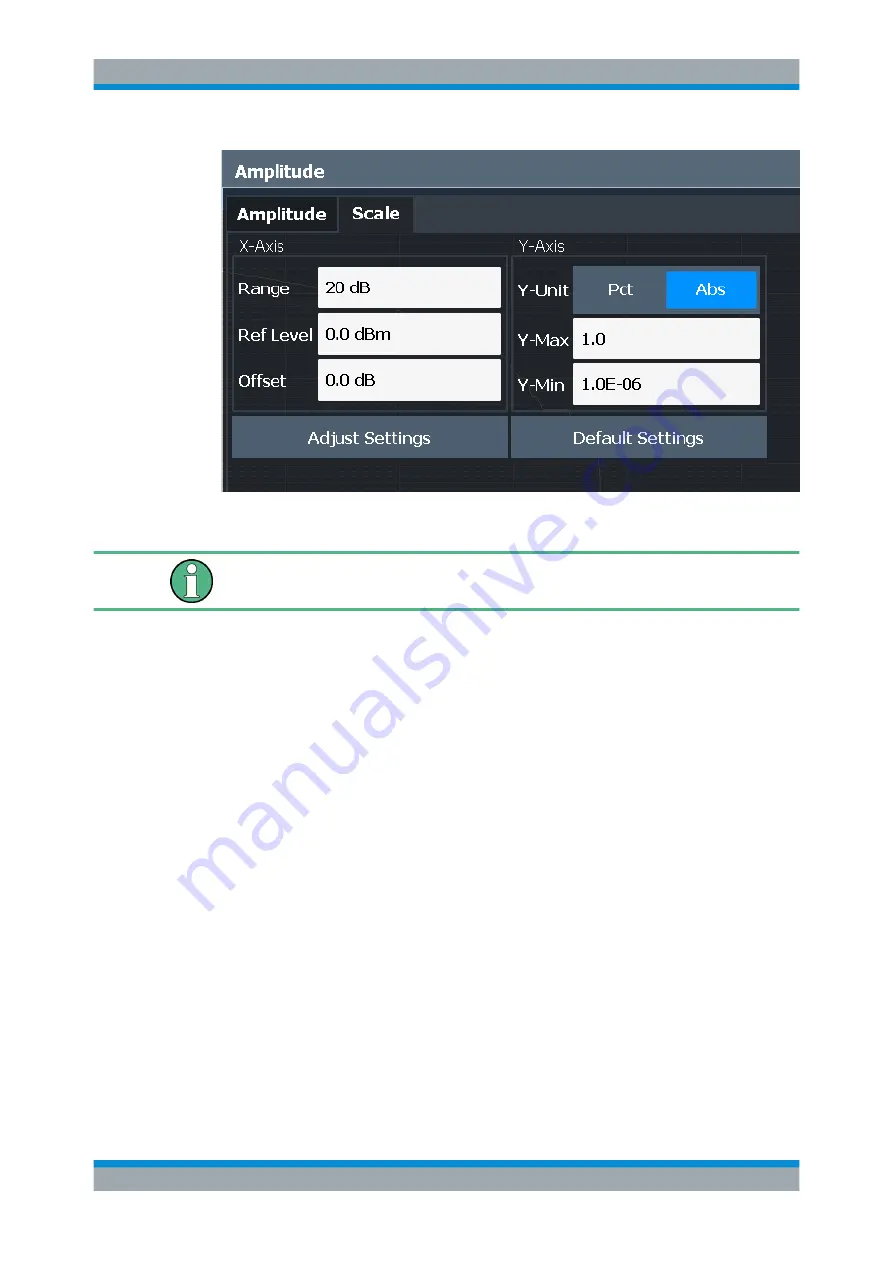
Figure 7-41: Scale settings for CCDF diagram
In statistical diagrams, the x-axis displays the signal level values (= y-axis in standard
display), while the y-axis displays the probability of the values.
Shifting the Display ( Offset )
........................................................................ 274
...............................................................................................274
X-Axis
Defines the scaling settings for signal level values.
Ref Level ← X-Axis
Defines the reference level for the signal levels in the currently active unit (dBm, dBµV,
etc.).
For the APD function this value corresponds to the right diagram border. For the CCDF
function there is no direct representation of this value on the diagram as the x-axis is
scaled relatively to the measured mean power.
Remote command:
CALCulate<n>:STATistics:SCALe:X:RLEVel
Range ← X-Axis
Defines the level range in dB to be evaluated by the statistics measurement.
Statistical Measurements (APD, CCDF)


