Common Analysis and Display Functions
R&S
®
FSVA3000/ R&S
®
FSV3000
501
User Manual 1178.8520.02 ─ 01
If you combine the two settings, 20 sweeps will be performed for each single sweep
measurement. The first 10 will be averaged to create the first frame, the next 10 will be
averaged to create the second frame.
As you can see, increasing the sweep count increases the accuracy of the individual
traces, while increasing the frame count increases the number of traces in the diagram.
Especially for "Average" or "Min Hold" and "Max Hold" trace modes, the number of
sweeps that are analyzed to create a single trace has an effect on the accuracy of the
results. Thus, you can also define whether the results from frames in previous traces
are considered in the analysis for each new trace ( "Continue Frame" ).
Tracking absolute time - timestamps
Alternatively to the frame count, the absolute time (that is: a
timestamp
) at which a
frame was captured can be displayed. While the measurement is running, the time-
stamp shows the system time. In single sweep mode or if the sweep is stopped, the
timestamp shows the time and date at the end of the sweep.Thus, the individual
frames can be identified by their timestamp or their frame count.
When active, the timestamp replaces the display of the frame number in the diagram
footer (see
Displaying individual frames
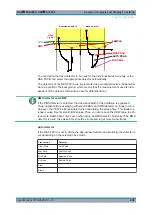
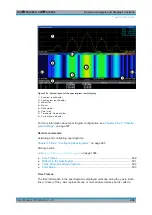
The spectrogram diagram contains all stored frames since it was last cleared. Arrows
on the left and right border of the spectrogram indicate the currently selected frame.
The spectrum diagram always displays the spectrum for the currently selected frame.
The current frame number is indicated in the diagram footer, or alternatively a time-
stamp, if activated. The current frame, displayed at the top of the diagram, is frame
number 0. Older frames further down in the diagram are indicated by a negative index,
e.g. "-10" . You can display the spectrum diagram of a previous frame by changing the
current frame number.
Markers in the Spectrogram
Markers and delta markers are shaped like diamonds in the spectrogram. They are
only displayed in the spectrogram if the marker position is inside the visible area of the
spectrogram. If more than two markers are active, the marker values are displayed in a
separate marker table.
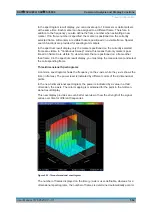
Markers in three-dimensional spectrograms are slightly different and are described in
"Markers in three-dimensional spectrograms"
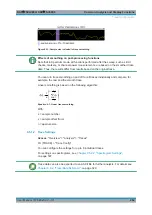
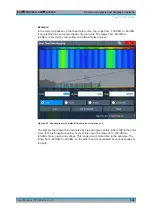
In the spectrum result display, the markers and their frequency and level values (1) are
displayed as usual. Additionally, the frame number is displayed to indicate the position
of the marker in time (2).
Trace Configuration

