Common Analysis and Display Functions
R&S
®
FSVA3000/ R&S
®
FSV3000
502
User Manual 1178.8520.02 ─ 01
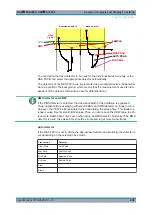
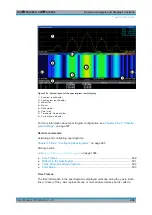
In the spectrogram result display, you can activate up to 16 markers or delta markers
at the same time. Each marker can be assigned to a different frame. Therefore, in
addition to the frequency you also define the frame number when activating a new
marker. If no frame number is specified, the marker is positioned on the currently
selected frame. All markers are visible that are positioned on a visible frame. Special
search functions are provided for spectrogram markers.
In the spectrum result display, only the markers positioned on the currently selected
frame are visible. In "Continuous Sweep" mode, this means that only markers posi-
tioned on frame 0 are visible. To view markers that are positioned on a frame other
than frame 0 in the spectrum result display, you must stop the measurement and select
the corresponding frame.
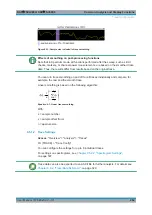
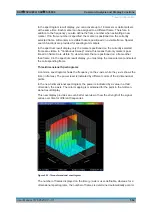
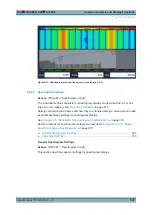
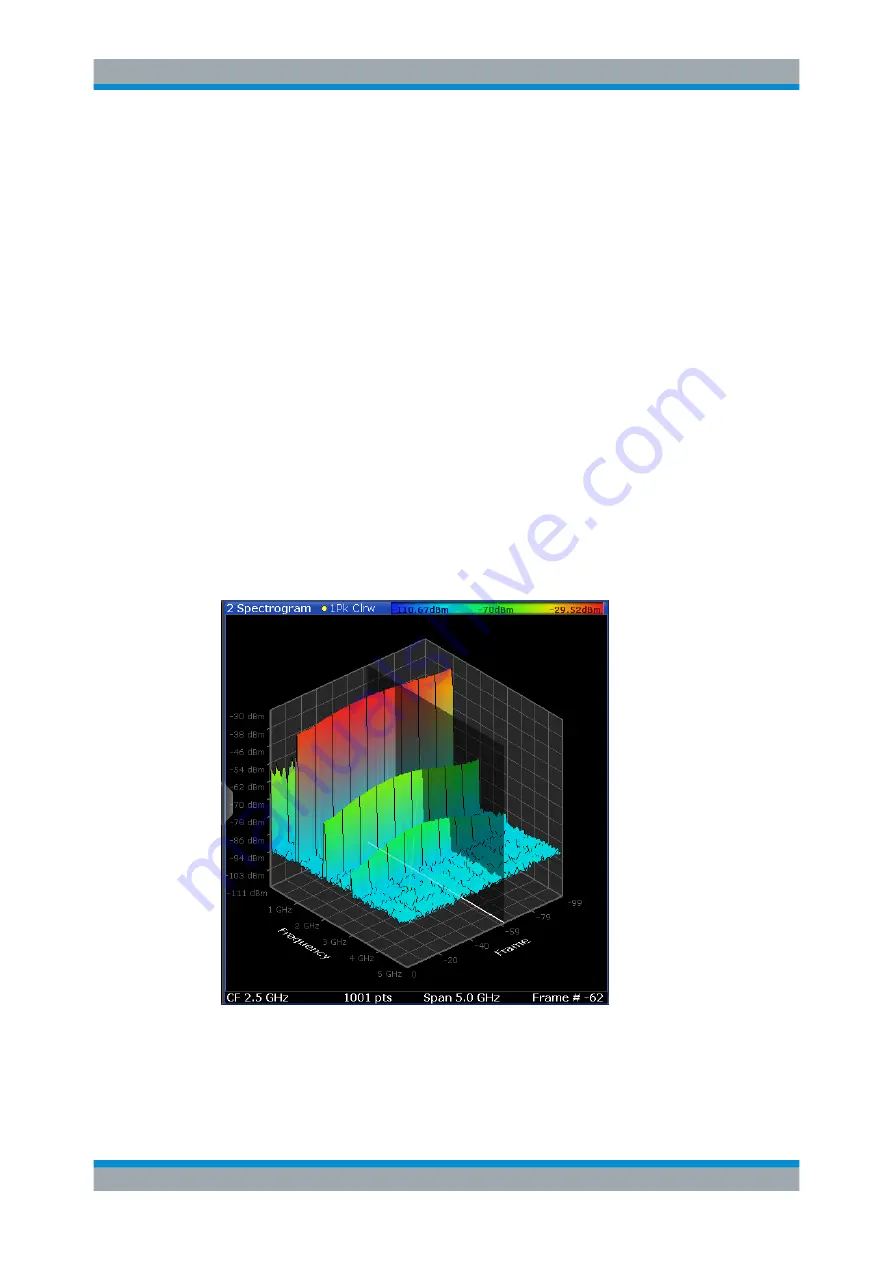
Three-Dimensional Spectrograms
A common spectrogram shows the frequency on the x-axis, while the y-axis shows the
time (in frames). The power level is indicated by different colors of the 2-dimensional
points.
In the new 3-dimensional spectrogram, the power is indicated by a value in a third
dimension, the z-axis. The color mapping is maintained for the point in the 3-dimen-
sional result display.
This new display provides an even better overview of how the strength of the signal
varies over time for different frequencies.
Figure 9-15: Three-dimensional spectrogram
The number of frames displayed on the time (y-)axis is user-definable, whereas for 2-
dimensional spectrograms, the number of frames is determined automatically accord-
Trace Configuration

