Getting Started
R&S
®
FSVA3000/ R&S
®
FSV3000
84
User Manual 1178.8520.02 ─ 01
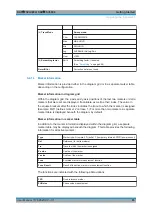
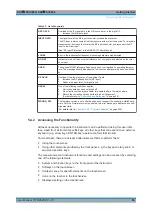
CNT
Signal count
TRK
Signal tracking
NOIse
Noise measurement
MDepth
AM modulation depth
TOI
Third order intercept measurement
5.4.1.4
Frequency and Span Information in Diagram Footer
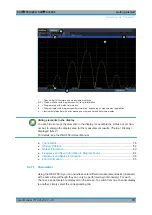
The information in the diagram footer (beneath the diagram) depends on the current
application, measurement, and result display.
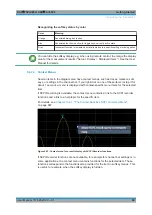
For a default measurement in the Spectrum mode, the Diagram result display contains
the following information, for example:
Label
Information
CF
Center frequency
Span
Frequency span (frequency domain display)
ms/
Time per division (time domain display)
Pts
Number of sweep points or (rounded) number of currently displayed points in zoom
mode
5.4.1.5
Instrument and Status Information
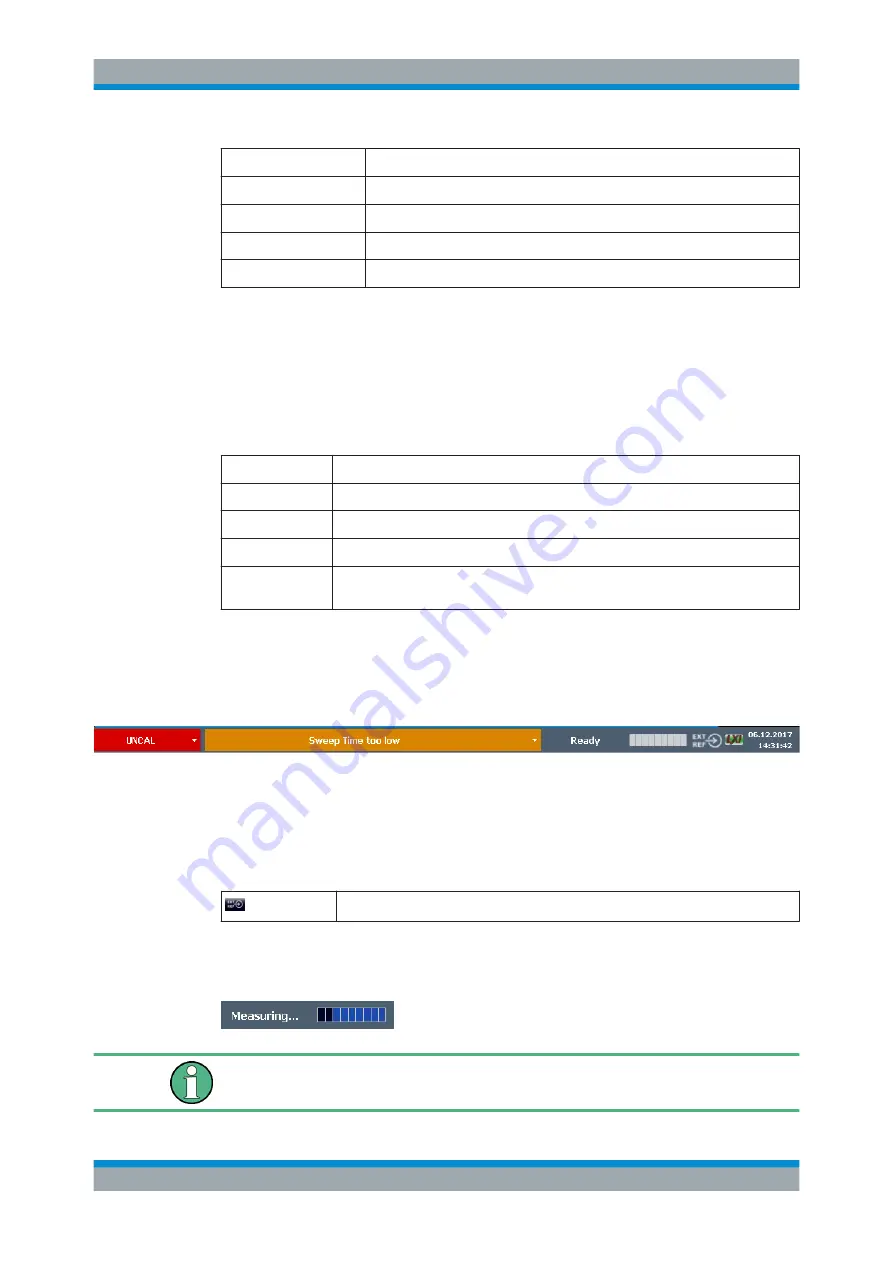
Global instrument settings and functions (such as LXI configuration mode), the instru-
ment status and any irregularities are indicated in the status bar beneath the diagram.
In the MultiView tab, the status bar always displays the information for the currently
selected measurement.
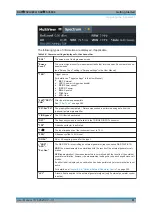
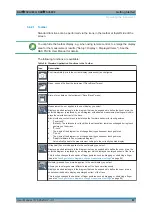
The following information is displayed:
Instrument status
The instrument is configured for operation with an external reference.
Progress
The progress of the current operation is displayed in the status bar.
In the MultiView tab, the progress bar indicates the status of the currently selected
measurement, not the measurement a Sequencer is currently performing, for example.
Operating the Instrument

