Measurements and Results
R&S
®
FSVA3000/ R&S
®
FSV3000
125
User Manual 1178.8520.02 ─ 01
After each sweep is completed, a new one is started automatically. While the mea-
surement is running, the [RUN CONT] key is highlighted. To stop the measure-
ment, press the [RUN CONT] key again. The key is no longer highlighted. The
results are not deleted until a new measurement is started.
7.2.3
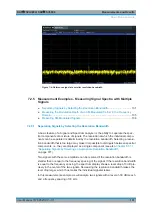
Measurement Examples - Measuring a Sinusoidal Signal
One of the most common measurement tasks that can be handled using a signal ana-
lyzer is determining the level and frequency of a signal. When measuring an unknown
signal, you can usually start with the presettings.
High input values
If levels higher than +30 dBm (=1
W) are expected or are possible, a power attenuator
must be inserted before the RF input of the analyzer. Otherwise, signal levels exceed-
ing 30
dBm can damage the RF attenuator or the input mixer. The total power of all
occurring signals must be taken into account.
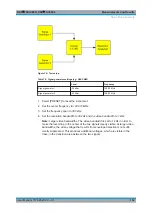
Test setup
●
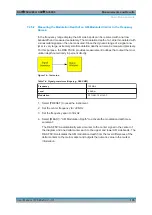
Connect the RF output of the signal generator to the RF input of the R&S
FSV/A.
Table 7-1: Signal generator settings (e.g. R&S SMW)
Frequency
128 MHz
Level
-30 dBm
Measuring the Level and Frequency Using Markers
.............................................125
Measuring the Signal Frequency Using the Signal Counter
................................. 127
7.2.3.1
Measuring the Level and Frequency Using Markers
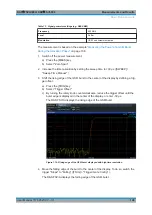
The level and frequency of a sinusoidal signal can be measured easily using the
marker function. The R&S
FSV/A always displays its amplitude and frequency at the
marker position. The frequency measurement uncertainty is determined by the refer-
ence frequency of the R&S
FSV/A, the resolution of the marker frequency display and
the number of sweep points.
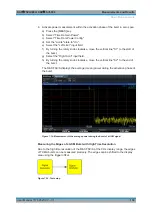
1. Select [PRESET] to reset the instrument.
2. Connect the signal to be measured to the "RF INPUT" connector on the
R&S
FSV/A.
3. Set the center frequency to
128
MHz
.
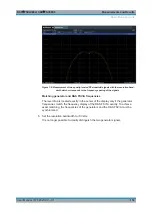
4. Reduce the frequency span to
1
MHz
.
Basic Measurements

