Measurements and Results
R&S
®
FSVA3000/ R&S
®
FSV3000
251
User Manual 1178.8520.02 ─ 01
File contents
Explanation
PeaksPerRange;1;
Max. number of peaks per range to be detected
Values;2;
Number of detected peaks
File data section
0;-12750000;-2515000;30000;13242367500;-43.844
722747802734;-0.33028793334960938;49.6697120
66650391;FAIL;
Measured peak values:
<range number>;
<start frequency>;
<stop frequency>;
<resolution bandwidth of range>;
<frequency of peak>;
<absolute power in dBm of peak>;
<relative power in dBc of peak>; (related to the
channel power)
<distance to the limit line in dB>; (positive value
means above the limit)
<limit fail (pass = 0, fail =1)>;
2;2515000;12750000;30000;13257632500;-43.8447
22747802734;-0.33028793334960938;49.66971206
6650391;FAIL;
7.7
Spurious Emissions Measurement
Spurious Emissions measurements monitor unwanted RF products outside the
assigned frequency band generated by an amplifier.
........................................................................................251
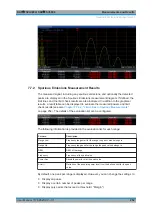
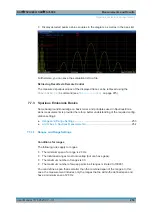
Spurious Emissions Measurement Results
...........................................................252
...................................................................................253
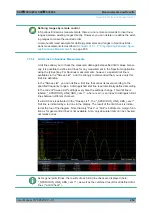
Spurious Emissions Measurement Configuration
................................................. 255
How to Perform a Spurious Emissions Measurement
...........................................261
Reference: ASCII Export File Format (Spurious)
..................................................263
7.7.1
About the Measurement
The Spurious Emissions measurement monitors unwanted RF products outside the
assigned frequency band generated by an amplifier. The spurious emissions are usu-
ally measured across a wide frequency range. The Spurious Emissions measurement
allows a flexible definition of all parameters. A result table indicates the largest devia-
tions of the absolute power from the limit line for each range, and the results can be
checked against defined limits automatically.
Spurious Emissions Measurement

