Common Analysis and Display Functions
R&S
®
FSVA3000/ R&S
®
FSV3000
426
User Manual 1178.8520.02 ─ 01
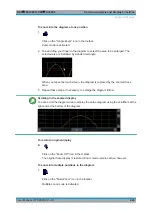
To perform a measurement zoom
Performing a measurement zoom automatically adapts the measurement settings to
reflect a graphically zoomed display.
1. Select the "Measurement Zoom" icon from the toolbar.
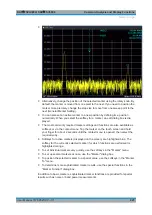
2. Do one of the following to define the zoom area:
● Stretch two fingers in the diagram to enlarge the area between them.
● Tap and drag one finger in the diagram to select the area to be enlarged. The
selected area is indicated by a dotted rectangle.
The measurement settings are adapted as required to obtain the zoomed result
display.
9.3
Marker Usage
Markers help you analyze your measurement results by determining particular values
in the diagram. Thus you can extract numeric values from a graphical display both in
the time and frequency domain. In addition to basic markers, sophisticated marker
functions are provided for special results such as noise or demodulation.
Markers in Spectrogram Displays
In the spectrogram result display, you can activate up to 16 markers or delta markers
at the same time. Each marker can be assigned to a different frame. Therefore, in
addition to the frequency you also define the frame number when activating a new
marker. If no frame number is specified, the marker is positioned on the currently
selected frame. All markers are visible that are positioned on a visible frame.
.................................................................................................426
Marker Search Settings and Positioning Functions
.............................................. 435
Marker (Measurement) Functions
.........................................................................442
................................................................................... 463
Measurement Example: Measuring Harmonics Using Marker Functions
9.3.1
Basics on Markers
Some background knowledge on marker settings and functions is provided here for a
better understanding of the required configuration settings.
Markers are used to mark points on traces, to read out measurement results and to
select a display section quickly. R&S
FSV/A provides 16 markers per display window.
In the Spectrum application, the same markers are displayed in all windows.
Marker Usage

