Data Management
R&S
®
FSVA3000/ R&S
®
FSV3000
558
User Manual 1178.8520.02 ─ 01
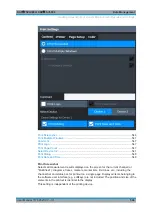
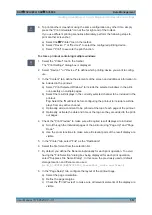
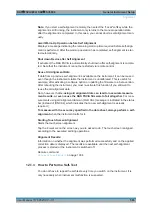
9. In the "Color" tab, define the colors to be used for the printout.
a) By default, "Optimized Colors" are used to improve the visibility of the colors.
The background is always printed in white and the grid in black.
For a printout that reflects the colors you see on the screen, but with a white
background, select "Screen Colors (Print)" .
b) Check the "Print Preview" to find out if the setting is appropriate.
10. Select "Print" to execute the print function.
11. If you did not select the option to suppress the dialog, enter a filename in the file
selection dialog box.
The selected data elements are stored to the file as configured.
12. To store another file using the same configuration any other time, simply press the
"Print immediate" icon at the far right end of the toolbar.
If you use different printing scenarios alternately, perform the following steps to
store another file:
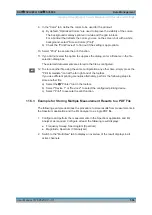
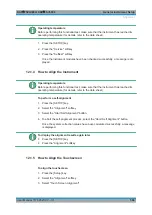
a) Select the "Printer" tool in the toolbar.
b) Select "Device 1" or "Device 2" to select the configured printing device.
c) Select "Print" to execute the print function.
11.5.3
Example for Storing Multiple Measurement Results to a PDF File
The following example describes the procedure to store results from measurements in
the Spectrum application and the I/Q Analyzer to a single PDF file.
1. Configure and perform the measurements in the Spectrum application and I/Q
Analyzer as required. Configure at least the following result displays:
● Frequency Sweep, Spectrogram (Spectrum)
● Magnitude, Spectrum (I/Q Analyzer)
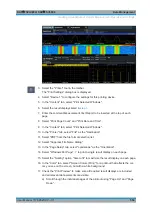
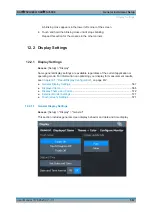
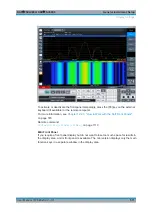
2. Switch to the "MultiView" tab to display an overview of the result displays in all
active channels.
Creating Screenshots of Current Measurement Results and Settings

