Operating the instrument
R&S
®
RTE
84
Getting Started 1326.1026.02 ─ 10
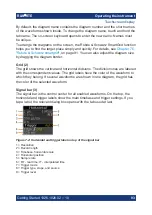
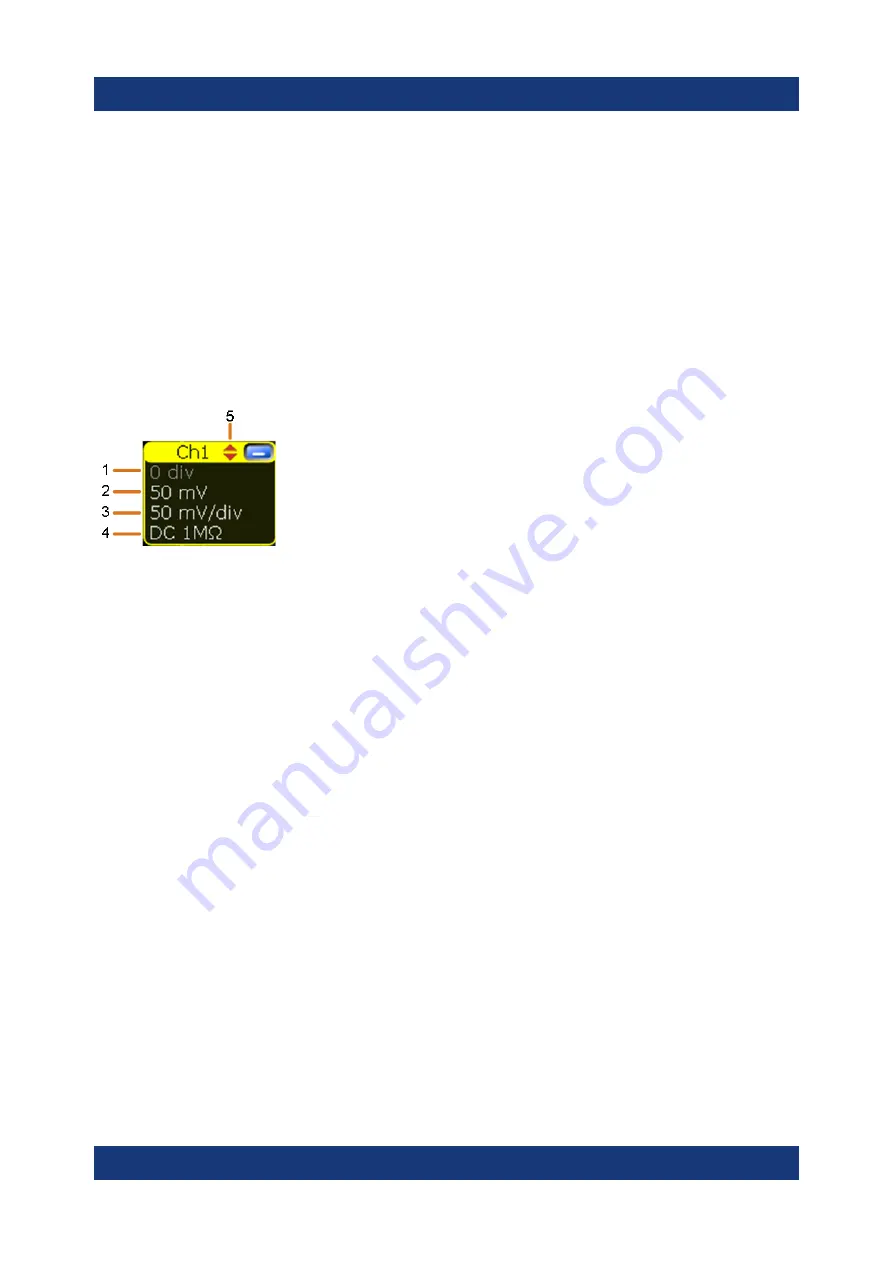
Below, each waveform is represented by a signal icon. If the waveform is shown
in a diagram, the signal icon displays its main vertical and acquisition settings. If
you tap the "Minimize" icon on the signal icon, the waveform switches from the
diagram area to the signal icon: the icon shows the real-time preview of the wave-
form. If you tap a signal icon, the dialog box with vertical settings for this wave-
form opens. See
Chapter 7.4, "Working with waveforms"
detailed description.
In
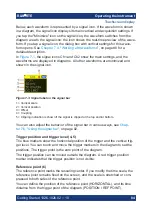
, the signal icons Ch1 and Ch2 show the main settings, and the
waveforms are displayed in diagrams. All other waveforms are minimized and
shown in the signal icon.
Figure 7-3: Signal label on the signal bar
1 = Vertical scale
2 = Vertical position
3 = Offset
4 = Coupling
5 = Clipping indication is shown if the signal is clipped at the top and/or bottom.
You can also adjust the behavior of the signal bar in various ways, see
ter 7.6, "Using the signal bar"
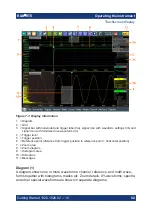
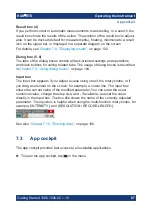
Trigger position and trigger level (4, 5)
The blue markers show the horizontal position of the trigger and the vertical trig-
ger level. You can touch and move the trigger markers in the diagram to set the
positions. The trigger point is the zero point of the diagram.
The trigger position can be moved outside the diagram. A red trigger position
marker indicates that the trigger position is not visible.
Reference point (6)
The reference point marks the rescaling center. If you modify the time scale, the
reference point remains fixed on the screen, and the scale is stretched or com-
pressed to both sides of the reference point.
You can define the position of the reference point (HORIZONTAL), and its time
distance from the trigger point of the diagram (POSITION / REF POINT).
Touchscreen display


