Operating the instrument
R&S
®
RTE
92
Getting Started 1326.1026.02 ─ 10
The Rohde
&
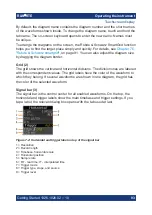
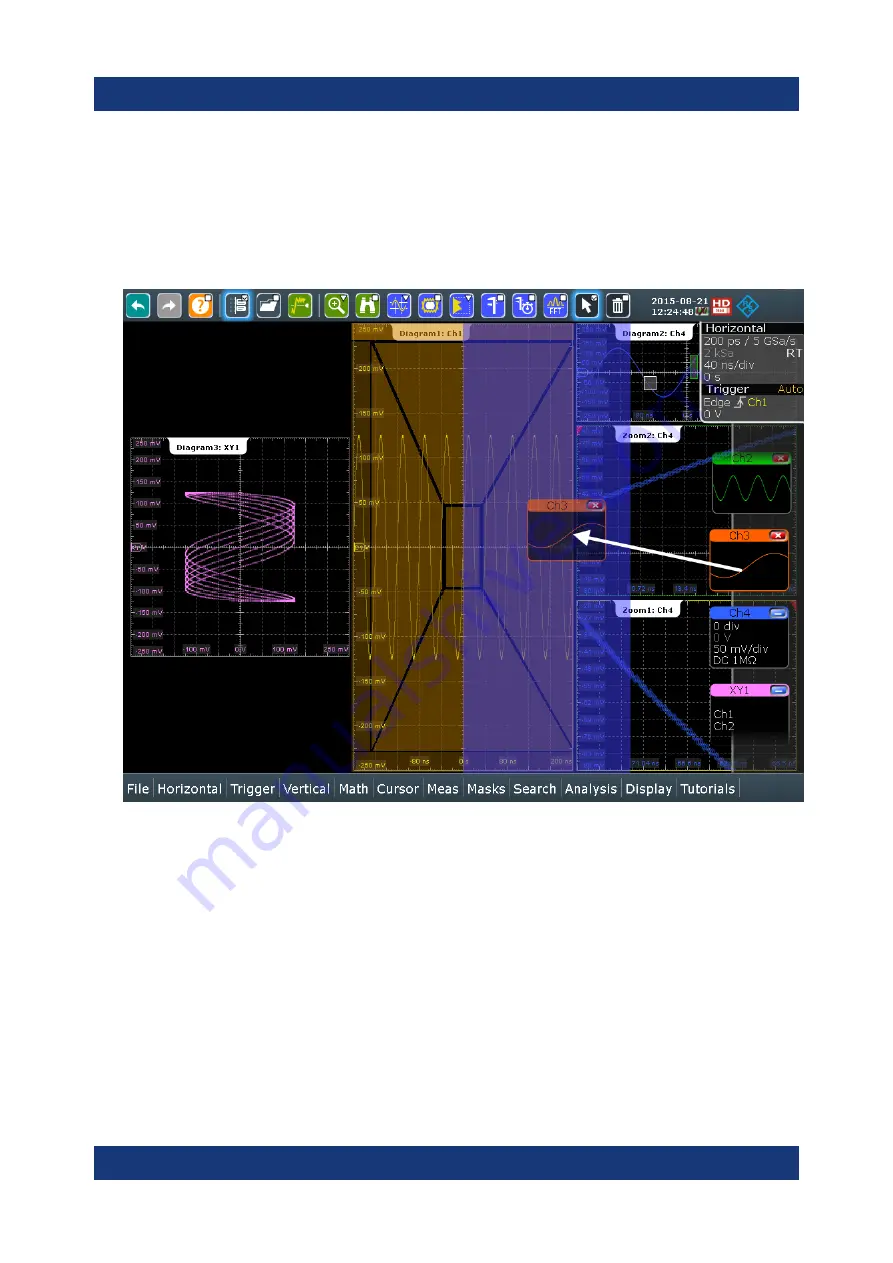
Schwarz SmartGrid appears and a blue area shows where the
waveform will be placed.
2. Drop the waveform in the target area.
The waveform appears in an existing or in a new diagram, and it is selected
for further actions.
3. To change the size of the new diagram, drag its edge to the required position.
7.6
Using the signal bar
The signal bar can hold a large number of signal and result icons. Signal icons
represent the waveforms, serial buses and parallel buses, while result icons are
minimized result boxes showing measurement and search results.
Using the signal bar

