


Application Example: GSM AM Suppression Test
R&S
®
SMW-K550
20
User Manual 1178.3263.02 ─ 01
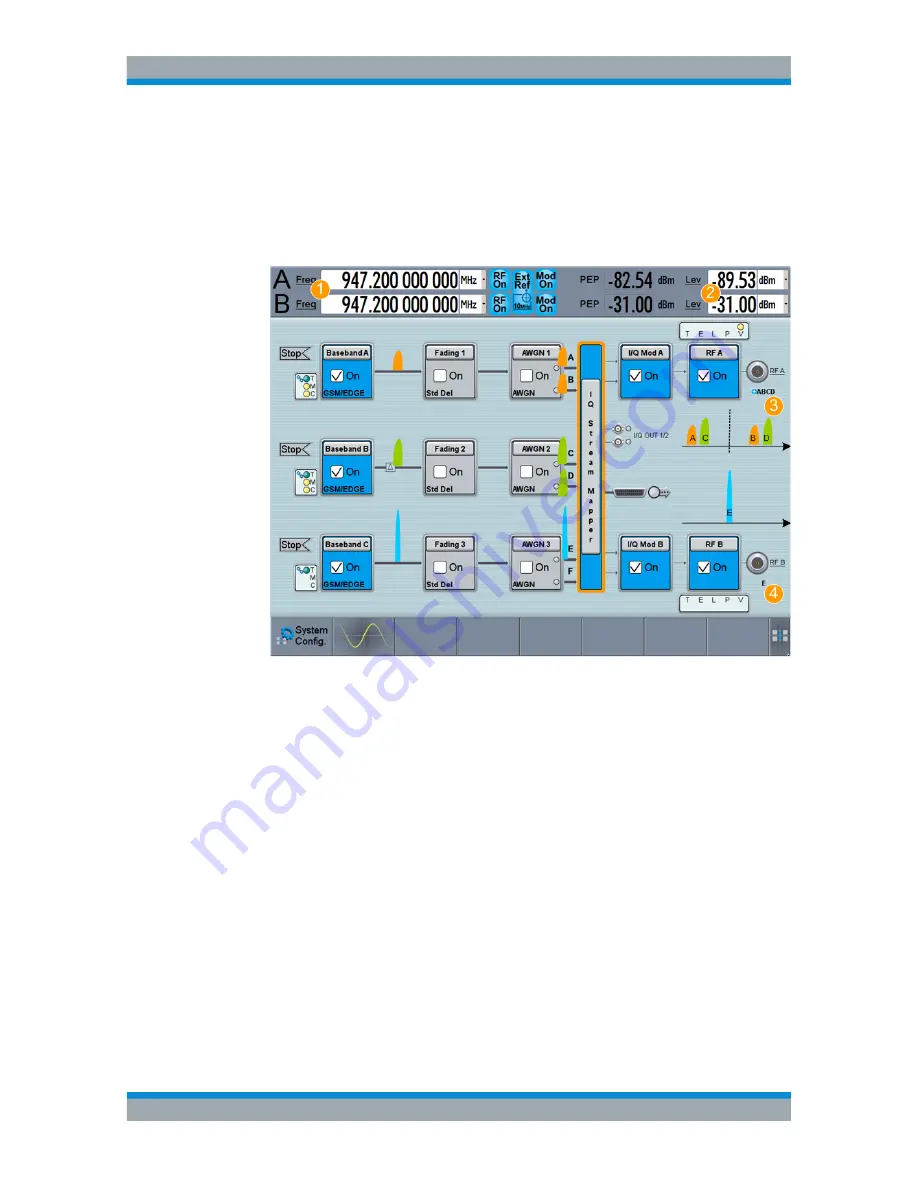
2. In the block diagram, activate the RF outputs.
The display resembles the one on the following figure. The additional information
on
Figure 4-3
illustrates the routing and the frequency allocation of the wanted and
the interfering signals.
Note that the streams generated form the same baseband are not transmitted on
nearby carriers.
Figure 4-3: Block diagram: understanding the displayed information
1 = Interferer frequency
2 = Sum power level of the 4 wanted signals, interfering signal power level
3 = Streams A, B, C and D (i.e. the 4 wanted signals) are routed to output RF A
4 = Stream E (i.e. the interferer) is output at the RF B
How to Generate Signals for GSM AM Suppression Tests


