Chapter 6: Using the Web Interface
321
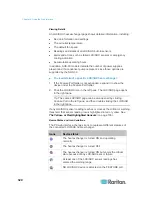
To identify the cause of the critical state, view one of the following.
The LHX/SHX Heat Exchanger section of the Dashboard page. See
Viewing the Summary
(on page 319).
The Feature Port page. See
Viewing the Summary
(on page 319).
The Alert States section of the LHX heat exchanger page. See
Alert
States and LHX Event Log
(on page 321).
Alert States and LHX Event Log
Remote Alert Acknowledgment is supported by the LHX-20 and LHX-40.
The SHX-30 does not support Remote Alert Acknowledgment.
When an LHX heat exchanger is physically connected to the PX device,
a section labeled Alert States appears on its device page. The Alert
States section shows information identifying the LHX sensors that
currently fail.
Tip: The Dashboard and Feature Port pages also point out failed sensors.
See
Viewing the Summary
(on page 319).
A button labeled Show Event Log is located in the Alert States section.
To view LHX events associated with the PX, click this button.
Note: To view the event log for an SHX-30, click Maintenance > View
Event Log.
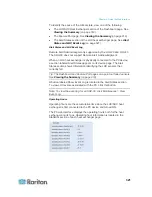
Operating Hours
Operating hours are the accumulative time since the LHX/SHX heat
exchanger is first connected to the PX device and turned ON.
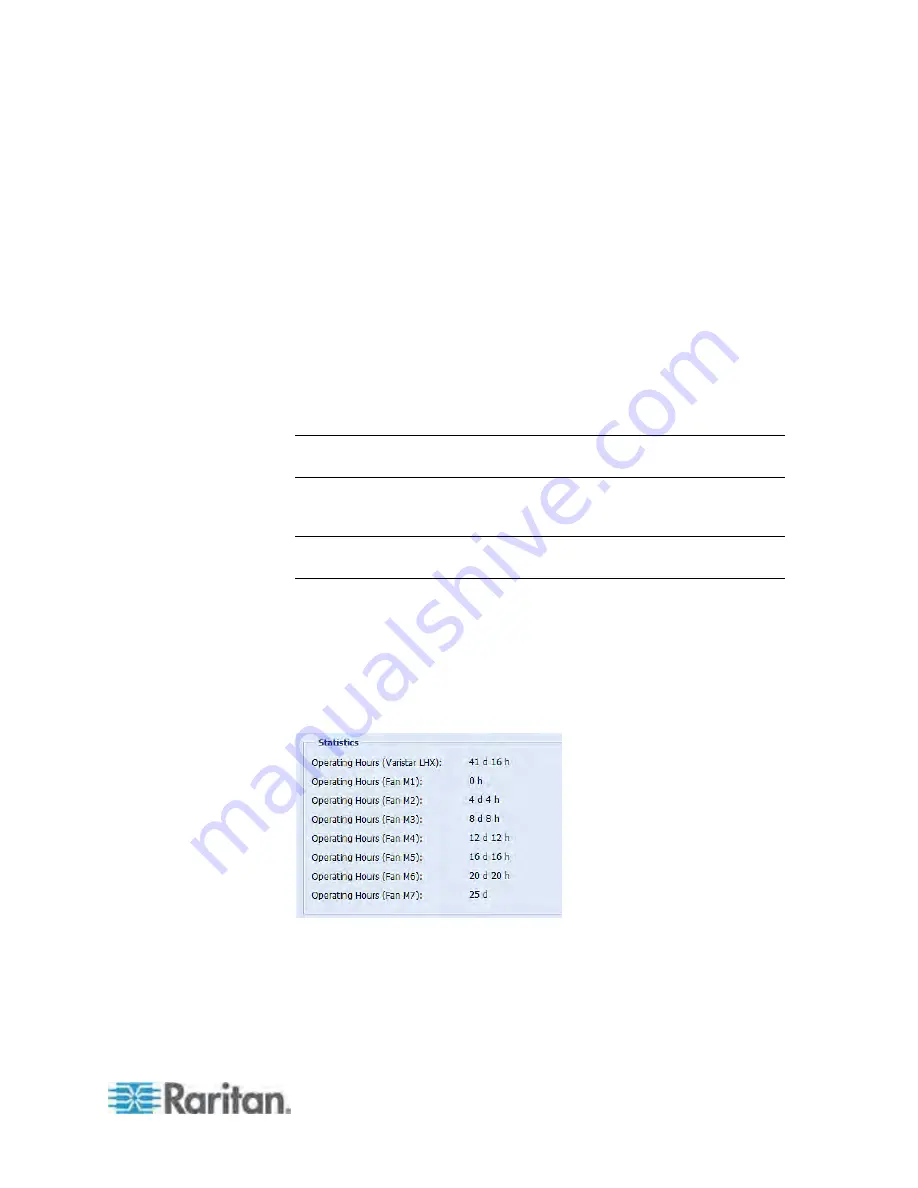
The PX web interface displays the operating hours both for the heat
exchanger and its fans. Operating hour information is located in the
Statistics section of each heat exchanger page.
Summary of Contents for PX3-4000 series
Page 5: ......
Page 627: ...Appendix I RADIUS Configuration Illustration 606 Note If your PX uses PAP then select PAP...
Page 632: ...Appendix I RADIUS Configuration Illustration 611 14 The new attribute is added Click OK...
Page 633: ...Appendix I RADIUS Configuration Illustration 612 15 Click Next to continue...
Page 648: ...Appendix J Integration 627 3 Click OK...
Page 661: ...Appendix J Integration 640 2 Launch dcTrack to import the spreadsheet file...

