


Chapter 6: Using the Web Interface
167
Viewing Sensor or Actuator Data
Readings and states of the environmental sensors or actuators will
display in the web interface after the sensors and actuators are properly
connected and managed.
The Dashboard page shows the information of managed environmental
sensors and actuators only, while the Peripheral Devices page shows
the information of both managed and unmanaged ones.
Both pages indicate an environmental sensor or actuator's position in
either of the following manners:
Port <n>
, where <n> is the number of the SENSOR port on the PDU
where a specific environmental sensor package is connected. DPX
sensor packages show this information.
Port <n>, Chain Position <pos_num>
, where <pos_num> is the
sensor package's sequential position in a sensor daisy chain. DPX2
and DX sensor packages show this information.
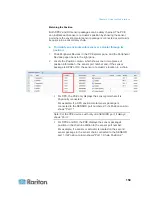
If a sensor row is colored, it means the sensor reading already crosses
one of the thresholds, the sensor enters an alarmed state, or the
overcurrent protector has tripped or blown. See
The Yellow- or
Red-Highlighted Sensors
(on page 46).
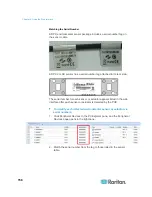
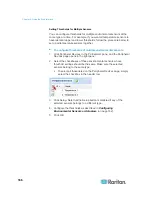
To view managed environmental sensors and actuators only:
1. Click the Dashboard icon in the PX Explorer pane, and the
Dashboard page opens in the right pane.
2. Locate the Peripheral Devices section on the Dashboard page. The
section shows:
Total number of managed sensors and actuators
Total number of unmanaged sensors and actuators
Information of each managed sensor and actuator, including:
- Name
- Position
- Reading (for numeric sensors)
- State
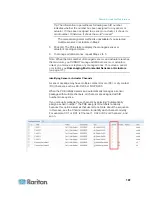
To view both managed and unmanaged ones:
Click Peripheral Devices in the PX Explorer pane, and the Peripheral
Devices page opens in the right pane.
Detailed information for each connected sensor or actuator is
displayed, including:
ID
number
Name
Summary of Contents for PXE
Page 16: ......
Page 339: ...Appendix A Specifications 323 RS 485 Pin signal definition al 4 5 6 D bi direction al Data 7 8...
Page 380: ...Index 364 Z Zero U Products 1...
Page 381: ......


