Diagnostics and Troubleshooting: Visualize Spray Data
21
DIAGNOSTICS AND TROUBLESHOOTING
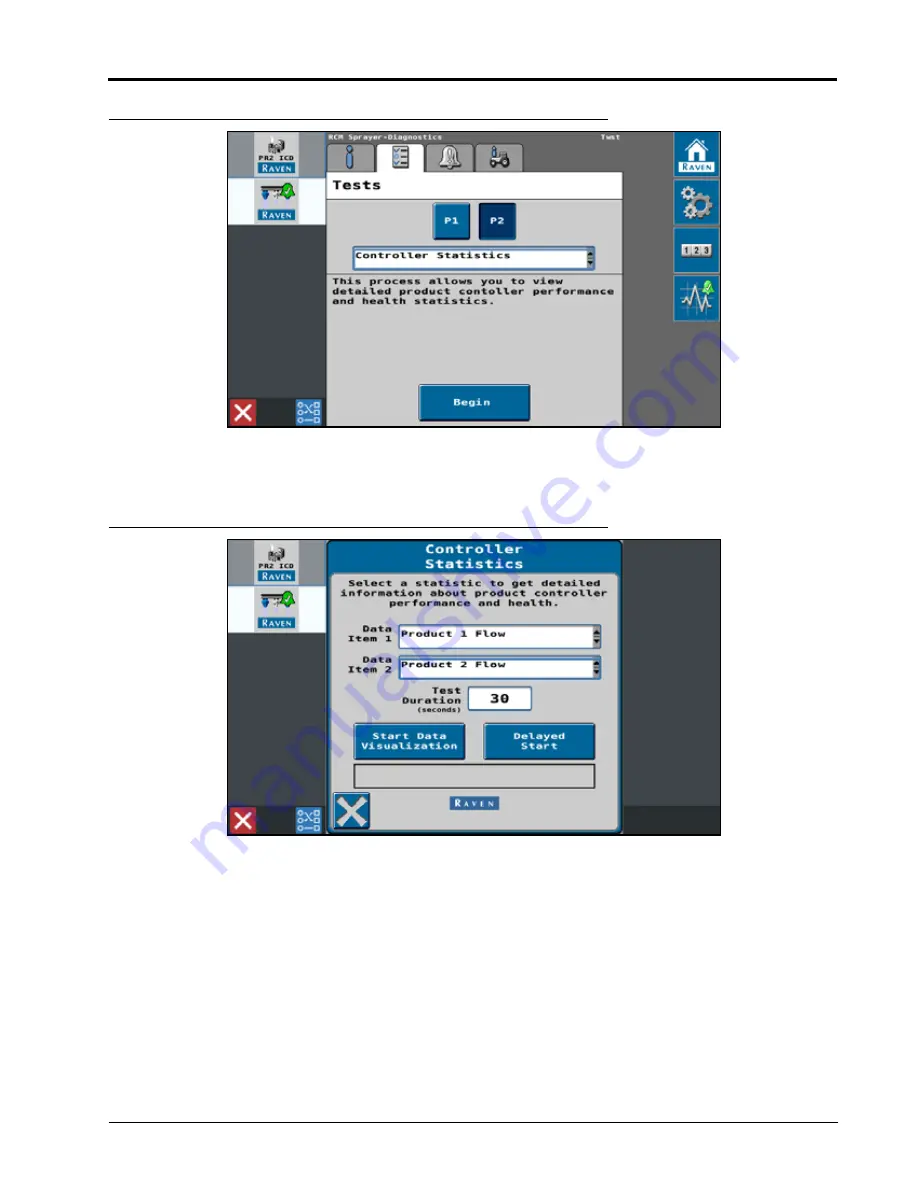
FIGURE 4. Begin Controller Statistics Test
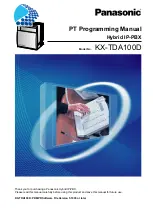
5. On the Controller Statistics page, use the Data Item 1 and Data Item 2 drop-down options to set which data to
visualize.
FIGURE 5. Controller Statistics Data Visualization Setup
6. For an RCM-Sprayer with one injection pump, set Data Item 1 to Product 1 Flow to show the main product flow
and Data Item 2 to Product 2 Flow to show the injection pump flow.
NOTE:
If there are more injection pumps on the system, the machine operator may select Product Flow 1 and
Product Flow 3 to view flow from different injection pumps.
Summary of Contents for RCM
Page 10: ...CHAPTER 2 6 RCM Sprayer Ratio Rate without Boom Control Calibration and Operation Manual...
Page 20: ...CHAPTER 3 16 RCM Sprayer Ratio Rate without Boom Control Calibration and Operation Manual...
Page 28: ...CHAPTER 5 24 RCM Sprayer Ratio Rate without Boom Control Calibration and Operation Manual...


