19.7 The sonar image
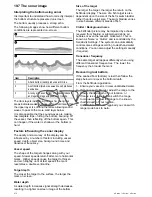
Interpreting the bottom using sonar
It is important to understand how to correctly interpret
the bottom structure represented on-screen.
The bottom usually produces a strong echo.
The following images show how different bottom
conditions are represented on-screen:
D
6
8
5
5
-3
1
2
3
Item
Description
1
A hard bottom (sand) produces a thin line.
2
A soft bottom (mud or seaweed cover) produces
a wide line.
3
A rocky or uneven bottom or a wreck produces
an irregular image with peaks and troughs.
The dark layers indicate a good echo; the lighter
areas indicate weaker echoes. This could mean that
the upper layer is soft and therefore allowing sound
waves to pass to the more solid layer below.
It is also possible that the sound waves are making
two complete trips – hitting the bottom, bouncing off
the vessel, then reflecting off the bottom again. This
can happen if the water is shallow or the bottom is
hard.
Factors influencing the sonar display
The quality and accuracy of the display can be
influenced by a number of factors including vessel
speed, depth, object size, background noise and
transducer frequency.
Vessel speed
The shape of the target changes along with your
speed. Slower speeds return flatter, more horizontal
marks. Higher speeds cause the target to thicken
and arch slightly, until at fast speeds the mark
resembles a double vertical line.
Target depth
The closer the target to the surface, the larger the
mark on screen.
Water depth
As water depth increases signal strength decreases,
resulting in a lighter onscreen image of the bottom.
Size of the target
The larger the target, the larger the return on the
fishfinder display. The size of a fish target is also
dependent upon the size of the fish’s swim bladder
rather than its overall size. The swim bladder varies
in size between different breeds of fish.
Clutter / Background noise
The fishfinder picture may be impaired by echoes
received from floating or submerged debris, air
bubbles or even the vessel's movement. This is
known as ‘Noise’ or ‘Clutter’ and is controlled by the
Sensitivity Settings. The system can automatically
control some settings according to depth and water
conditions. You can also adjust the settings manually
if required.
Transducer frequency
The same target will appear differently when using
different transducer frequencies. The lower the
frequency the broader the mark.
Recovering lost bottom
If the seabed floor (bottom) is lost then follow the
steps below to recover the bottom depth.
From the fishfinder application:
1. Ensure your vessel is in clear undisturbed water.
2. If range is set to Manual, adjust the range to the
known, charted depth of your location. or
3. If range is set to Auto then switch the range
to manual and adjust the range to the known,
charted depth of your location.
4. Once bottom has been regained you can switch
range mode back to Auto.
272
a Series / c Series / e Series
Summary of Contents for A series
Page 2: ......
Page 14: ...14 a Series c Series e Series...
Page 41: ...13 GPS receiver 14 Thermal camera 15 Wireless connection Planning the installation 41...
Page 48: ...48 a Series c Series e Series...
Page 80: ...80 a Series c Series e Series...
Page 118: ...118 a Series c Series e Series...
Page 184: ...184 a Series c Series e Series...
Page 188: ...188 a Series c Series e Series...
Page 206: ...206 a Series c Series e Series...
Page 228: ...228 a Series c Series e Series...
Page 290: ...290 a Series c Series e Series...
Page 310: ...310 a Series c Series e Series...
Page 340: ...340 a Series c Series e Series...
Page 374: ...374 a Series c Series e Series...
Page 422: ...422 a Series c Series e Series...
Page 436: ...436 a Series c Series e Series...
Page 462: ...462 a Series c Series e Series...
Page 463: ......
Page 464: ...www raymarine com...


