Chapter 13: RayTech advanced features
121
graph plots and data matrices, which can be edited to suit your needs. A
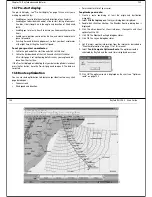
typical polars plot screen is shown below.
Data collection
The accuracy of any analysis presented by the polars tool is dependent on
the volume and accuracy of the data collected. There are two primary areas
within the polars application where you can enter and modify data:
•
The
Polar
tab - this displays the polar parameters screen, which
contains variables/ values used to plot the polar graph.
•
The
Data
tab - this displays the data tests screen, which enables the
input of advanced, boat/weather performance-related information that
you can use to further fine-tune the analysis.
These screens come pre-loaded with default data, however, it is essential
to replace as much of this information as possible with real performance/
atmospheric -specific data. You can use RayTech’s Data Trak and Data
Logging functions to record a wide variety of performance-related data
that is ideal for use with these screens. Data from these screens can also
come from such sources as your boat’s manufacturer and local nautical
organizations.
Entering and editing data
Data is entered using the polar and data parameters tabs.
Polar parameters
To edit the polar parameters:
1. Click
Polar
tab in the Polar Plot dialog box.
2. Replace as much of the default data as possible with actual data that
you have collected. You can modify the default values shown, or load
an existing polar parameters file. To modify the values shown, refer to
Step 3.
D7027
1
122
RayTech RNS V6.0 - Users Guide
To load an existing polar parameters file:
i.
Click
Open
in the polar parameters box. The open file dialog box
is displayed.
ii. Choose the polar parameters file (.rpl extension) that you want to
open.
iii. Click
Open
. The selected file will be displayed.
3. To edit individual values:
i.
Click on the cell that you want to modify. The value is highlighted.
ii. Enter a new value, click outside of the cell. The new value will be
accepted.
iii. Repeat Steps i and ii for each value you want to change.
4. If you want to view data without saving it, go to Step 5. If you want to
save the data that has been entered either:
5. Click
Save
. The file will be saved under the current file name, or,
6. Click
Save As
, if you want to create and name a new polar variables
file.
7. Click
Apply
to use the new variables in the polar plot.
8. Click the
Polar Plot
tab to view the new data graph.
D7028
1
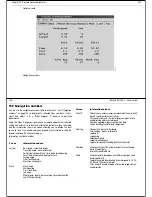
The definitions for the cells in the table are:
Tws
True wind speed - in knots
Bsp0
0
Boat speed in knots at zero degrees (sailing directly into the
wind)
TwaUp
True wind angle Upwind - in degrees
BspUp
Boat speed Upwind - in knots
Twa1
True wind angle - in degrees (first variable)
Bsp1
Boat speed - in knots (first variable)
Twa2
True wind angle -in degrees (second variable)
Bsp2
Boat speed - in knots (second variable)
TwaDn
True wind angle Downwind - in degrees
BspDn
Boat speed Downwind - in knots
Bsp180
Boat speed - in knots - at 180 degrees (sailing directly with the
wind).
Summary of Contents for Pathfinder
Page 1: ......


