39
Auto-ranging display
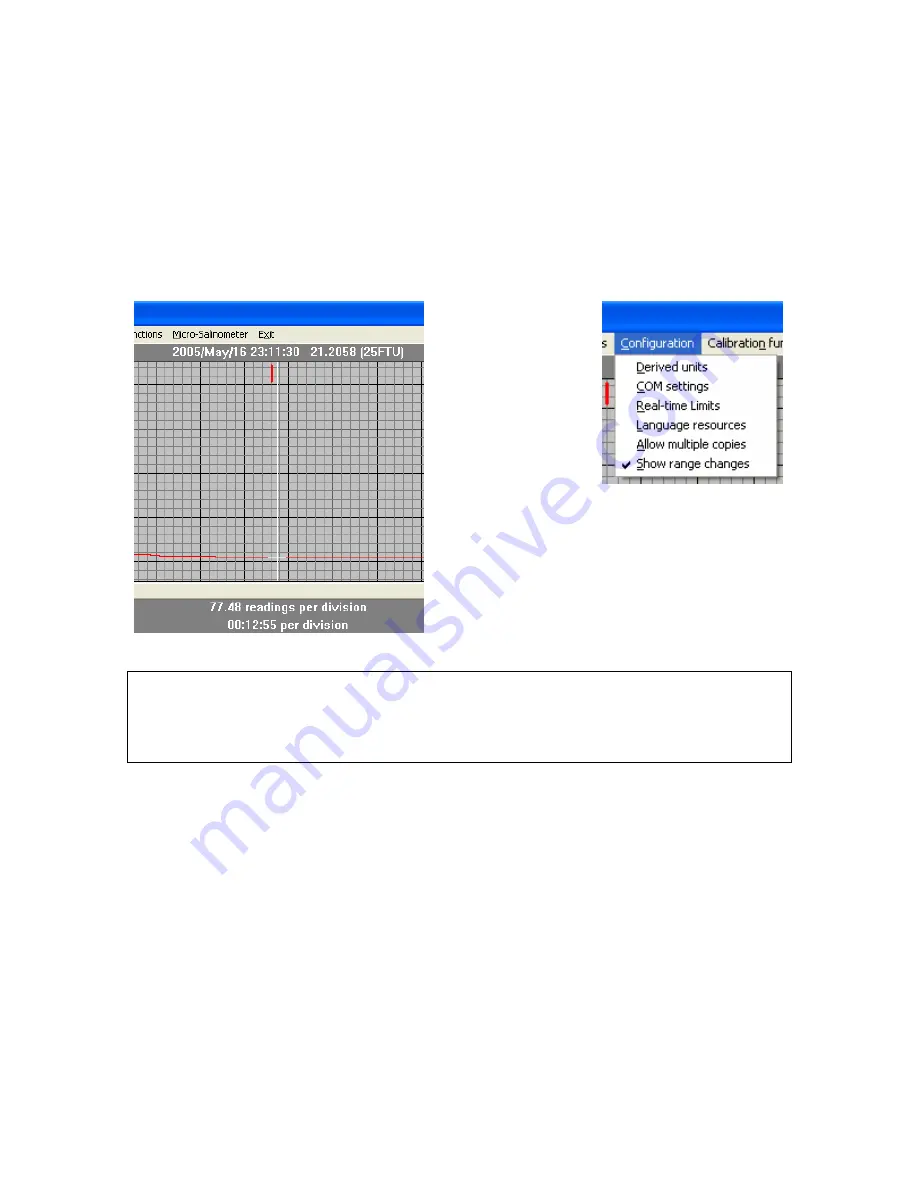
When data from a logger having an auto-ranging sensor is displayed, the cursor
display will show the full-scale range for each reading as shown. The heavy
vertical bar at the top of the graph marks the point in time of the change of gain.
These change of gain markers are the same colour as the corresponding
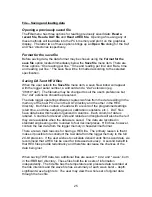
channel plot. These markers can be turned on and off using the
Show range
changes
item in the
Configuration
menu. Gain changes are shown in the ‘dat’
file as shown.
Timestamp 2005/05/16 14:50:30 at sample 1 of type: GAIN STAMP channel=2 gain=0 (2500FTU)
Timestamp 2005/05/16 16:21:10 at sample 545 of type: GAIN STAMP channel=2 gain=1 (500FTU)
Timestamp 2005/05/16 17:26:00 at sample 934 of type: GAIN STAMP channel=2 gain=2 (125FTU)
Timestamp 2005/05/16 23:03:10 at sample 2957 of type: GAIN STAMP channel=2 gain=3 (25FTU)


