Ameba-D Application Note
Application Note All information provided in this document is subject to legal disclaimers. © REALTEK 2020. All rights reserved.
16
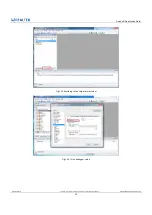
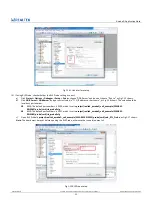
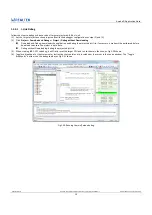
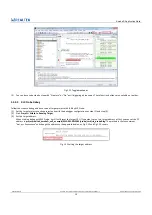
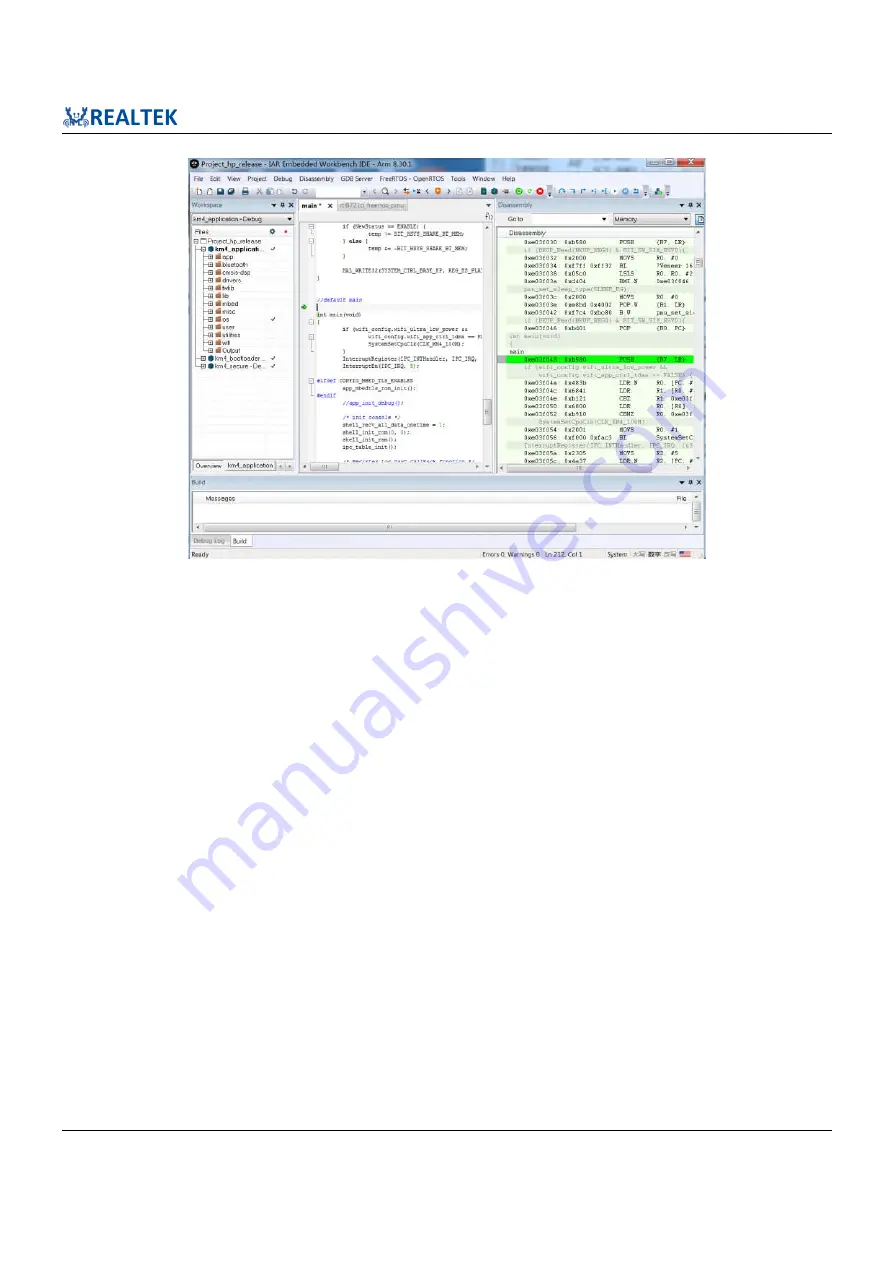
Fig 1-23 Running to the target address when debug
(4)
Toggles a breakpoint at the statement or instruction that contains or is located near the cursor in the source window. The “Toggle
Breakpoint” button is on the debug toolbar, as Fig 1-21 shows.
(5)
You can trace code step by step with “Step Into”, or “Go” until triggering a breakpoint. These function buttons are available on toolbar.
1.3.4.3
IAR Debug or Download Error
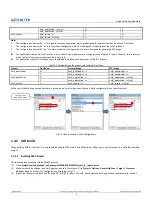
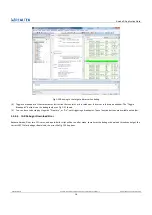
Because Ameba-D has two CPU cores, and a post-build script will be run after make, sometimes the debug or download thread cannot get the
correct AXF file for debug or download, the error like Fig 1-24 happens.

