Chapter 12. Tracepoints
99
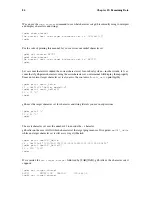
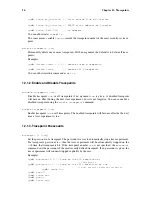
(gdb)
tfind start
(gdb)
while ($trace_frame != -1)
(
printf "Frame %d, PC = %08X, SP = %08X, FP = %08X\n", \
$trace_frame, $pc, $sp, $fp
(
tfind
(
end
Frame 0, PC = 0020DC64, SP = 0030BF3C, FP = 0030BF44
Frame 1, PC = 0020DC6C, SP = 0030BF38, FP = 0030BF44
Frame 2, PC = 0020DC70, SP = 0030BF34, FP = 0030BF44
Frame 3, PC = 0020DC74, SP = 0030BF30, FP = 0030BF44
Frame 4, PC = 0020DC78, SP = 0030BF2C, FP = 0030BF44
Frame 5, PC = 0020DC7C, SP = 0030BF28, FP = 0030BF44
Frame 6, PC = 0020DC80, SP = 0030BF24, FP = 0030BF44
Frame 7, PC = 0020DC84, SP = 0030BF20, FP = 0030BF44
Frame 8, PC = 0020DC88, SP = 0030BF1C, FP = 0030BF44
Frame 9, PC = 0020DC8E, SP = 0030BF18, FP = 0030BF44
Frame 10, PC = 00203F6C, SP = 0030BE3C, FP = 0030BF14
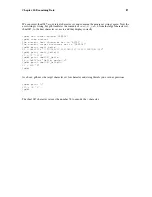
Or, if we want to examine the variable
X
at each source line in the buffer:
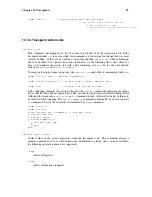
(gdb)
tfind start
(gdb)
while ($trace_frame != -1)
(
printf "Frame %d, X == %d\n", $trace_frame, X
(
tfind line
(
end
Frame 0, X = 1
Frame 7, X = 2
Frame 13, X = 255
12.2.2.
tdump
This command takes no arguments. It prints all the data collected at the current trace snapshot.
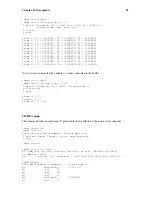
(gdb)
trace 444
(gdb)
actions
Enter actions for tracepoint #2, one per line:
(
collect $regs, $locals, $args, gdb_long_test
(
end
(gdb)
tstart
(gdb)
tfind line 444
#0
gdb_test (p1=0x11, p2=0x22, p3=0x33, p4=0x44, p5=0x55, p6=0x66)
at gdb_test.c:444
444
printp( "%s: arguments = 0x%X 0x%X 0x%X 0x%X 0x%X 0x%X\n", )
(gdb)
tdump
Data collected at tracepoint 2, trace frame 1:
d0
0xc4aa0085
-995491707
d1
0x18
24
d2
0x80
128
d3
0x33
51
d4
0x71aea3d
119204413
d5
0x22
34
Summary of Contents for ENTERPRISE LINUX 3 - SECURITY GUIDE
Page 1: ...Red Hat Enterprise Linux 3 Debugging with gdb ...
Page 12: ...2 Chapter 1 Debugging with gdb ...
Page 28: ...18 Chapter 4 Getting In and Out of gdb ...
Page 34: ...24 Chapter 5 gdb Commands ...
Page 44: ...34 Chapter 6 Running Programs Under gdb ...
Page 68: ...58 Chapter 8 Examining the Stack ...
Page 98: ...88 Chapter 10 Examining Data ...
Page 112: ...102 Chapter 12 Tracepoints ...
Page 118: ...108 Chapter 13 Debugging Programs That Use Overlays ...
Page 138: ...128 Chapter 14 Using gdb with Different Languages ...
Page 144: ...134 Chapter 15 Examining the Symbol Table ...
Page 170: ...160 Chapter 19 Debugging remote programs ...
Page 198: ...188 Chapter 21 Controlling gdb ...
Page 204: ...194 Chapter 22 Canned Sequences of Commands ...
Page 206: ...196 Chapter 23 Command Interpreters ...
Page 216: ...206 Chapter 25 Using gdb under gnu Emacs ...
Page 296: ...286 Chapter 27 gdb Annotations ...
Page 300: ...290 Chapter 28 Reporting Bugs in gdb ...
Page 322: ...312 Chapter 30 Using History Interactively ...
Page 362: ...352 Appendix D gdb Remote Serial Protocol ...
Page 380: ...370 Appendix F GNU GENERAL PUBLIC LICENSE ...
Page 386: ...376 Appendix G GNU Free Documentation License ...
Page 410: ......


