Chapter 6. Running Programs Under gdb
31
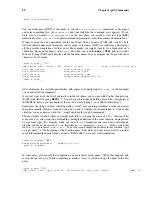
For debugging purposes, gdb associates its own thread number--always a single integer--with each
thread in your program.
info threads
Display a summary of all threads currently in your program. gdb displays for each thread (in this
order):
1. the thread number assigned by gdb
2. the target system’s thread identifier (
systag
)
3. the current stack frame summary for that thread
An asterisk
*
to the left of the gdb thread number indicates the current thread.
For example,
(gdb) info threads
3 process 35 thread 27
0x34e5 in sigpause ()
2 process 35 thread 23
0x34e5 in sigpause ()
* 1 process 35 thread 13
main (argc=1, argv=0x7ffffff8)
at threadtest.c:68
On HP-UX systems:
For debugging purposes, gdb associates its own thread number--a small integer assigned in thread-
creation order--with each thread in your program.
Whenever gdb detects a new thread in your program, it displays both gdb’s thread number and the
target system’s identification for the thread with a message in the form
[New
systag
]
.
systag
is a
thread identifier whose form varies depending on the particular system. For example, on HP-UX, you
see
[New thread 2 (system thread 26594)]
when gdb notices a new thread.
info threads
Display a summary of all threads currently in your program. gdb displays for each thread (in this
order):
1. the thread number assigned by gdb
2. the target system’s thread identifier (
systag
)
3. the current stack frame summary for that thread
An asterisk
*
to the left of the gdb thread number indicates the current thread.
For example,
(gdb) info threads
* 3 system thread 26607
worker (wptr=0x7b09c318 "@") \
at quicksort.c:137
2 system thread 26606
0x7b0030d8 in __ksleep () \
from /usr/lib/libc.2
Summary of Contents for ENTERPRISE LINUX 3 - SECURITY GUIDE
Page 1: ...Red Hat Enterprise Linux 3 Debugging with gdb ...
Page 12: ...2 Chapter 1 Debugging with gdb ...
Page 28: ...18 Chapter 4 Getting In and Out of gdb ...
Page 34: ...24 Chapter 5 gdb Commands ...
Page 44: ...34 Chapter 6 Running Programs Under gdb ...
Page 68: ...58 Chapter 8 Examining the Stack ...
Page 98: ...88 Chapter 10 Examining Data ...
Page 112: ...102 Chapter 12 Tracepoints ...
Page 118: ...108 Chapter 13 Debugging Programs That Use Overlays ...
Page 138: ...128 Chapter 14 Using gdb with Different Languages ...
Page 144: ...134 Chapter 15 Examining the Symbol Table ...
Page 170: ...160 Chapter 19 Debugging remote programs ...
Page 198: ...188 Chapter 21 Controlling gdb ...
Page 204: ...194 Chapter 22 Canned Sequences of Commands ...
Page 206: ...196 Chapter 23 Command Interpreters ...
Page 216: ...206 Chapter 25 Using gdb under gnu Emacs ...
Page 296: ...286 Chapter 27 gdb Annotations ...
Page 300: ...290 Chapter 28 Reporting Bugs in gdb ...
Page 322: ...312 Chapter 30 Using History Interactively ...
Page 362: ...352 Appendix D gdb Remote Serial Protocol ...
Page 380: ...370 Appendix F GNU GENERAL PUBLIC LICENSE ...
Page 386: ...376 Appendix G GNU Free Documentation License ...
Page 410: ......


