56
Chapter 8. Examining the Stack
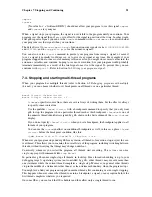
For example:
(gdb) up
#1
0x22f0 in main (argc=1, argv=0xf7fffbf4, env=0xf7fffbfc)
at env.c:10
10
read_input_file (argv[i]);
After such a printout, the
list
command with no arguments prints ten lines centered on the point
of execution in the frame. You can also edit the program at the point of execution with your favorite
editing program by typing
edit
. Refer to Section 9.1
Printing source lines
for details.
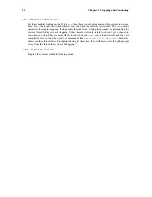
up-silently
n
down-silently
n
These two commands are variants of
up
and
down
, respectively; they differ in that they do their
work silently, without causing display of the new frame. They are intended primarily for use in
gdb command scripts, where the output might be unnecessary and distracting.
8.4. Information about a frame
There are several other commands to print information about the selected stack frame.
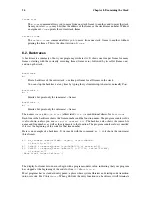
frame
f
When used without any argument, this command does not change which frame is selected, but
prints a brief description of the currently selected stack frame. It can be abbreviated
f
. With an
argument, this command is used to select a stack frame. Refer to Section 8.3
Selecting a frame
.
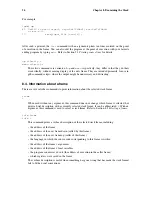
info frame
info f
This command prints a verbose description of the selected stack frame, including:
•
the address of the frame
•
the address of the next frame down (called by this frame)
•
the address of the next frame up (caller of this frame)
•
the language in which the source code corresponding to this frame is written
•
the address of the frame’s arguments
•
the address of the frame’s local variables
•
the program counter saved in it (the address of execution in the caller frame)
•
which registers were saved in the frame
The verbose description is useful when something has gone wrong that has made the stack format
fail to fit the usual conventions.
Summary of Contents for ENTERPRISE LINUX 3 - SECURITY GUIDE
Page 1: ...Red Hat Enterprise Linux 3 Debugging with gdb ...
Page 12: ...2 Chapter 1 Debugging with gdb ...
Page 28: ...18 Chapter 4 Getting In and Out of gdb ...
Page 34: ...24 Chapter 5 gdb Commands ...
Page 44: ...34 Chapter 6 Running Programs Under gdb ...
Page 68: ...58 Chapter 8 Examining the Stack ...
Page 98: ...88 Chapter 10 Examining Data ...
Page 112: ...102 Chapter 12 Tracepoints ...
Page 118: ...108 Chapter 13 Debugging Programs That Use Overlays ...
Page 138: ...128 Chapter 14 Using gdb with Different Languages ...
Page 144: ...134 Chapter 15 Examining the Symbol Table ...
Page 170: ...160 Chapter 19 Debugging remote programs ...
Page 198: ...188 Chapter 21 Controlling gdb ...
Page 204: ...194 Chapter 22 Canned Sequences of Commands ...
Page 206: ...196 Chapter 23 Command Interpreters ...
Page 216: ...206 Chapter 25 Using gdb under gnu Emacs ...
Page 296: ...286 Chapter 27 gdb Annotations ...
Page 300: ...290 Chapter 28 Reporting Bugs in gdb ...
Page 322: ...312 Chapter 30 Using History Interactively ...
Page 362: ...352 Appendix D gdb Remote Serial Protocol ...
Page 380: ...370 Appendix F GNU GENERAL PUBLIC LICENSE ...
Page 386: ...376 Appendix G GNU Free Documentation License ...
Page 410: ......


