Motion
Meter
High Speed Video Camera
_____________________________________________________________________________
9400-0024 Rev. G
1-3
OPERATOR'S INSTRUCTIONS
1.2.4
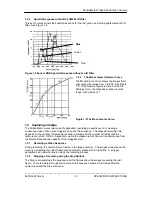
Spectral Response without the CM500 IR Filter
This set of curves shows the spectral response for the red, green, and blue signals without an IR
filter. See Figure 1-4.
Figure 1-4 Sensor RGB Spectral Response without an IR Filter.
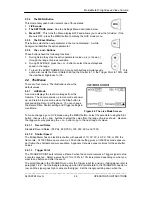
1.2.5
The Monochrome (Gamma) Curve
The Monochrome Curve shows the imager 8-bit
gray scale with values from 0 to 255. See Figure
1-5. If the Gamma feature is turned off on the
Settings menu, the response is linear over the
range, with a slope of 1.
Figure 1-5 The Monochrome Curve.
1.3 Capturing an Image
The
Motion
Meter serves two types of application: recording a specific event, or viewing a
continuous video until an event triggers an end to the sequence. The elapsed recording time
depends on the number of frames per second recorded and the number of frames that the
memory can store. Refer to Appendix A where the elapsed record time can be determined from
the Record Rate and the capacity of the Image Memory.
1.3.1
Recording a Video Sequence
During recording, the camera stores frames in the image memory. The images wrap around the
memory overwriting the oldest frame until an operator presses the Stop button, or a trigger
generated by an external source stops the recording process.
1.3.2
Stopping a Recording using the Stop Buttons
The Stop command stops the sequence and the frames show the images preceding the last
frame. There is a delay through the camera so the sequence shows a few frames after the
camera received the Stop command.
Blue
Green
Red


