Operation
PT12
Manual
7/20/2021
Page
18
of
48
4.3.2
RESISTANCE
GRAPH
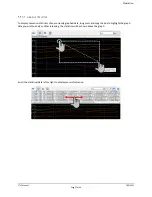
The
resistance
display
graph
is
identical
to
the
temperature
graph
of
section
4.3.1
Temperature
Graph
Display
Mode,
with
the
exception
that
values
shown
and
graphed
are
probe
resistances
rather
than
temperatures.
4.3.3
ALL
TEMPERATURE
DISPLAY
MODE
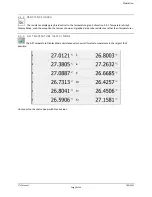
The
All
Temperature
Display
Mode
simultaneously
shows
all
twelve
temperatures
in
the
largest
font
possible.
Unconnected
channels
appear
with
blank
values.


