- 22 -
9LHZHU
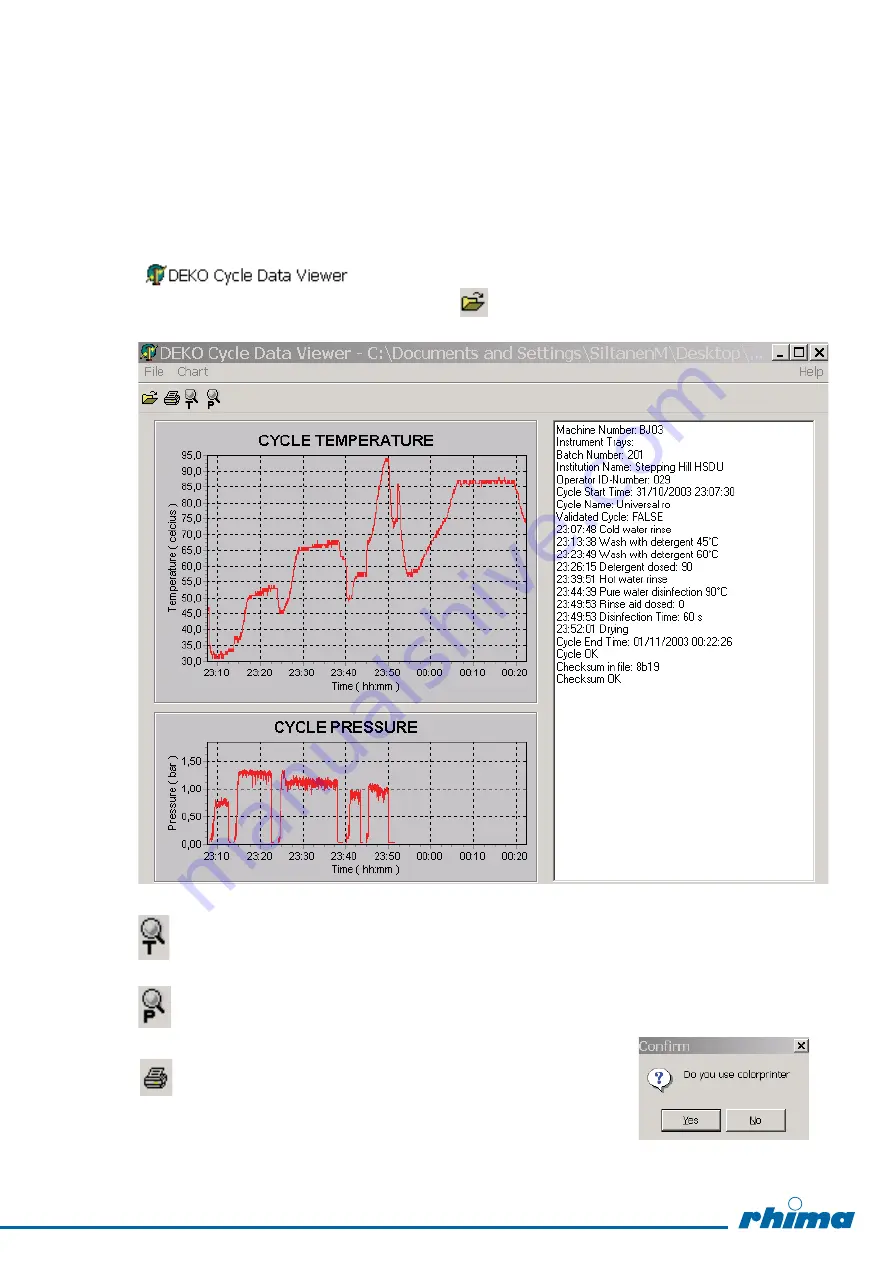
The recorded cycle curves can be seen using Deko Cycle Data Viewer-program.
The program is opened by double clicking the Shortcut of the viewer:
The wanted cycle data is opened by pressing
-key and then
double clicking the data file.
Zoom temperature:
Select a rectangular area from the display by pressing left button of the
mouse and release the button. By pressing right button the curve can be
moved on the display. Quit zooming.
Zoom pressure:
Same as above.
Print Charts:
By pressing PRINT CHARTS key, first question
is "Do you use colorprinter“. Select No, if you
do not have a colorprinter.
23
Summary of Contents for DEKO 25iX
Page 2: ...2 ...
Page 32: ...32 ...
Page 34: ...34 ...
Page 35: ...11 APPENDIX II USER INSTRUCTIONS USER INSTRUCTIONS 35 ...
Page 36: ...36 ...


