Installation
23
20102152
GB
4.12.3 Gas pressure
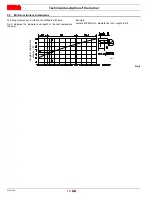
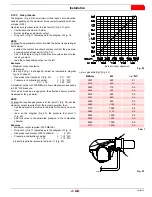
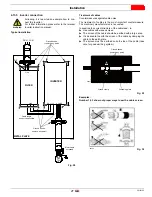
The diagram (Fig. 22) show minimum load losses at combustion
head depending on the maximum burner output operation with nat-
ural gas (G 20).
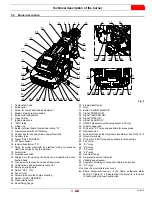
Gas pressure is measured at the test point 1)(Fig. 23), with:
•
Combustion chamber at 0 mbar
•
Burner working at maximum output
•
Ring nut 2) (Fig. 17) adjusted as in the diagram of Fig. 16
NOTE
To know the approximate output at which the burner is operating at
its maximum:
–
subtract the combustion chamber pressure from the gas pres-
sure measured at test point 1)(Fig. 23);
–
find, in the diagram (Fig. 22) the pressure value closest to the
result you want;
–
read the corresponding output on the left.
Example
• Maximum output operation
• Natural gas
• Gas ring 2)(Fig. 16 at page 20) adjust as indicated in diagram
•
Gas pressure at test point 1)(Fig. 23)
= 5.11 “WC
•
Pressure in combustion chamber
= 1.18 “WC
5.11 - 1.18
= 3.93 “WC
A maximum output of 3030 MBtu/hr shown diagrams corresponds
to 3.93 “WC pressure.
This value serves as a rough guide, the effective delivery must be
measured at the gas meter.
NOTE
To know the required gas pressure at test point 1) (Fig. 23), set the
maximum output required from the burner operation, then:
–
find the nearest output value in the table for the burner in ques-
tion.
–
read, on the diagram (Fig. 22), the pressure test point 1)
(Fig. 23);
–
add this value to the estimated pressure in the combustion
chamber.
Example
•
Maximum output required: 3750 MBtu/hr
•
Ring nut 2) (Fig. 17) adjusted as in the diagram of Fig. 16
•
Gas pressure at output of 2815 MBtu/hr
=
6 “WC
•
Pressure in combustion chamber
= 1.18 “WC
6 + 1.18
= 7.15 “WC
pressure required at pressure test point 1) (Fig. 23).
p “wc gas butterfly 2)(Fig. 23)
Tab. I
MBtu/hr
kW
p “WC
2047
600
0.1
2218
650
0.1
2440
715
0.2
2593
760
0.2
2815
825
0.2
3037
890
0.2
3258
955
0.2
3480
1020
0.3
3719
1090
0.3
3992
1170
0.3
4265
1250
0.4
4335
1300
0.5
4606
1350
0.5
4777
1400
0.5
Fig. 22
Burner output operation
D3182
p (“W
C
)
Fig. 23
1
2
D2441


