15 |
P a g e
R i g e l M e d i c a l U n i - T h e r m u s e r M a n u a l V 1 . 0
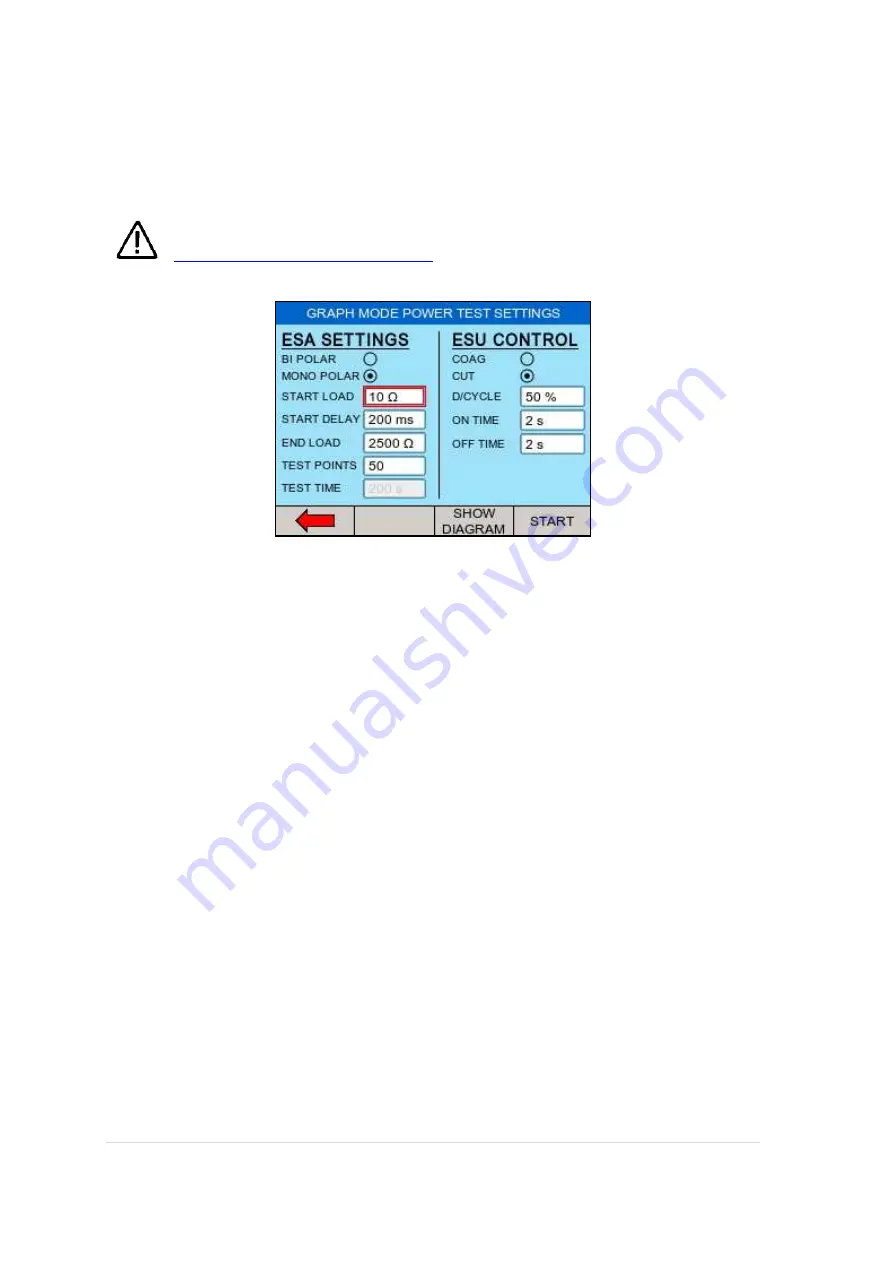
2.3.2 Graph mode
The graph mode allows the user to monitor the power characteristics under a range of
loads.
Ensure that the power settings on the EUT do not exceed those specified in the
Load Power rating Rigel Uni-Therm
Use the rotary encoder to navigate the screen. The selected field is marked with a red
border, presses the rotary encoder to activate the field to allow changes. Confirm and
de-activate the field by pressing the encoder once again.
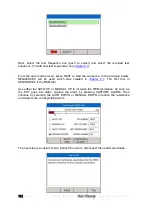
START LOAD is required to determine the starting resistance at which the power curve
measurement is carried out.
START DELAY will allow the user to set a measurement delay for generators operating
in a soft start mode.
END LOAD, will set the highest resistance at which the power curve measurement is
carried out.
TEST POINTS, determines the number of test points (resolution) of the power
distribution graph. The higher the number, the more detailed the power distribution
graphs.
The TEST TIME will display the total test time of the leakage test and dictate the amount
of tests done as a result of the selected ON TIME and OFF TIME and the number of test
points.
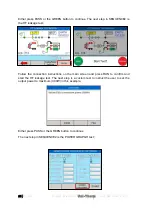
The BIPOLAR / MONO POLAR and COAG / CUT settings determine the type of
connection diagrams when the SHOW DIAGRAM button is pressed. The COAG / CUT
settings also determine the activation of the foot paddle control on the front of the Uni-
Therm.
Note: the duty cycle is limited to 50% or to protect the EUT from overheating. To
increase the ON time, the OFF time must be increased first in order to remain
within the duty cycle limits.


