24 |
P a g e
R i g e l M e d i c a l U n i - T h e r m u s e r M a n u a l V 1 . 0
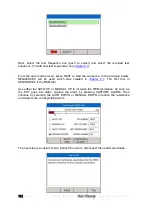
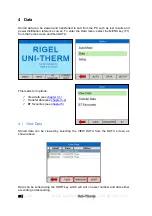
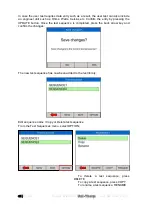
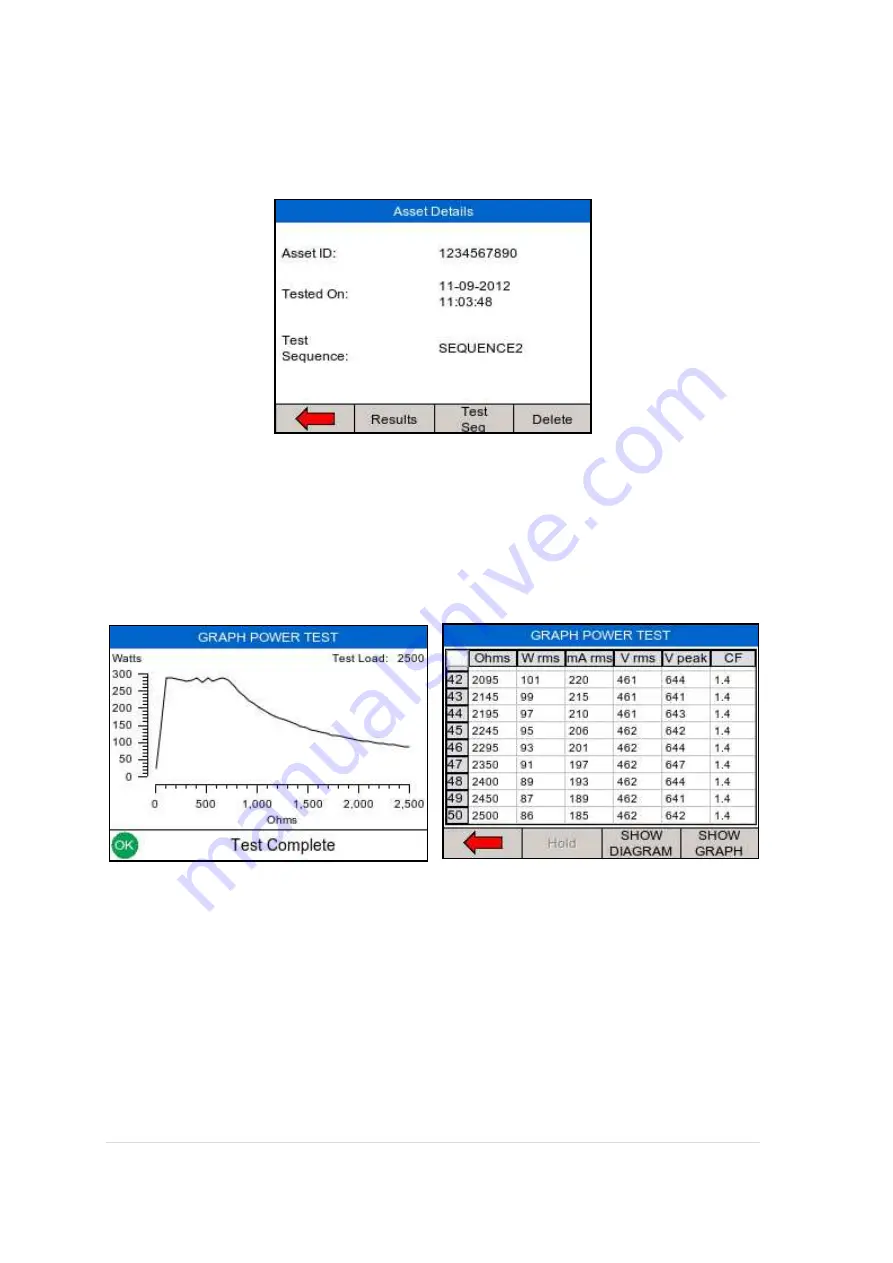
From the view data screen, results and test sequences can be viewed by pressing the
VIEW button and transferred to a PC by pressing TRANSFER;
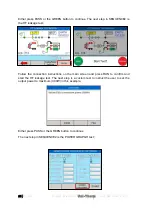
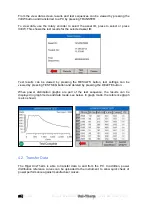
To view data, use the rotary encoder to select the asset ID, press to select or press
VIEW. This shows the test results for the selected asset ID;
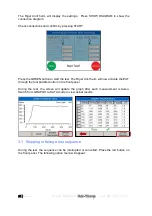
Test results can be viewed by pressing the RESULTS button, test settings can be
viewed by pressing TEST SEQ button and deleted by pressing the DELETE button.
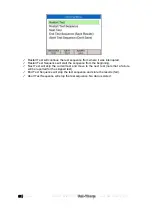
When power distribution graphs are part of the test sequence, the results can be
displayed in graph mode and data mode, see below. In graph mode, the reference graph
is also shown;
4.2 Transfer Data
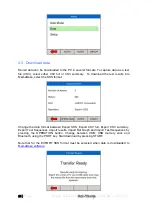
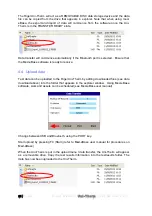
The Rigel Uni-Therm is able to transfer data to and from the PC. In addition, power
distribution reference curves can be uploaded to the instrument, to allow quick check of
power performance against manufacturer curves.


