122 • Chapter 9: Viewing Data in the Logs Window
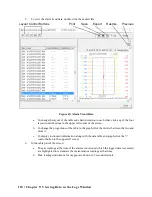
c. To view only events in the interval trend data file, click the
Only Event
selection box.
7.
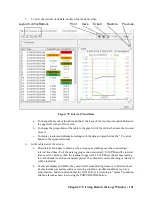
In the graph part of the screen:
a. You can choose which gas(es) you want to graph by selecting or deselecting the boxes
next to each gas name.
b. To zoom in on a particular part of the graph, drag a box around that area so that it is
highlighted in gray. The graph will zoom in. To return to a previous zoom, click the
Previous
control button in the upper right corner of the graph section. To return to the
original zoom, click the
Restore
control button in the upper right corner of the graph
section.
c. Clicking anywhere on the graph will cause a vertical red line to appear and the
corresponding data point will be highlighted in the table. Clicking a data point in the
table will move the red line in the graph to that data point.
Printing Data
1.
Select either
List
or
Graph
in the upper right corner of the window.
2.
Click the
control button in the upper right corner of the window. The
control
button has a printer icon on it.
3.
If
Graph
is selected, the data will print as a graph. If
List
is selected, the data will print as a
table.
Saving Data
1.
Select either
List
or
Graph
in the upper right corner of the window.
2.
Click the
Save to File
control button. The
Save to File
control button has a floppy disk icon on
it.
3.
A dialog box will appear for you to specify the file name, file location, and file type.
4.
Specify the file name and file location and click
Save
. If
List
is selected, the file type is “.csv”
(comma-separated values). If
Graph
is selected, the file type is “.bmp” (Windows bitmap).
Copying Data
1.
Select either
List
or
Graph
in the upper right corner of the window.
2.
Click the
Copy to Clipboard
control button. The
Copy to Clipboard
control button has a
clipboard icon on it. The table or graph will be saved to the clipboard.
3.
Paste the data into a document using the application’s Paste command.

