Rockwell Automation Publication 1441-UM006A-EN-P - May 2011
35
Run Up/Coast Down Extension Module
Chapter
2
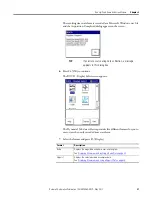
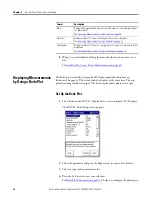
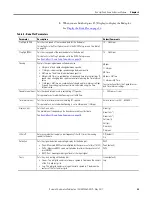
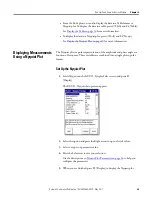
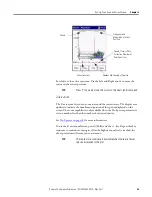
be relative to the active spectrum. Use the Left and Right arrows to move the
cursor on the active spectrum.
Z-axis Zoom
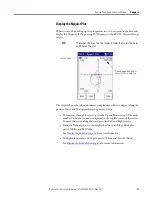
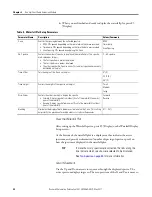
The Z-axis zoom lets you to zoom in around the current trace. The display area
updates to indicate the number and position of the spectra displayed on the
screen. The zoom capability is only available when the No. Spectra parameter is
set to a number less than the number of extracted spectra.
for more information.
To use the Z-axis zoom feature, press 0 (Shift) and the +/- key. Repeat this key
sequence to continue zooming in. After the highest zoom level is reached, the
above procedure will cause you to zoom out.
TIP
Press P to quickly move the cursor to the next significant peak.
TIP
There are more zoom levels available when there are fewer
spectra displayed in the plot.
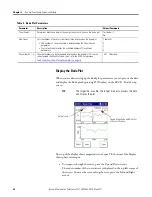
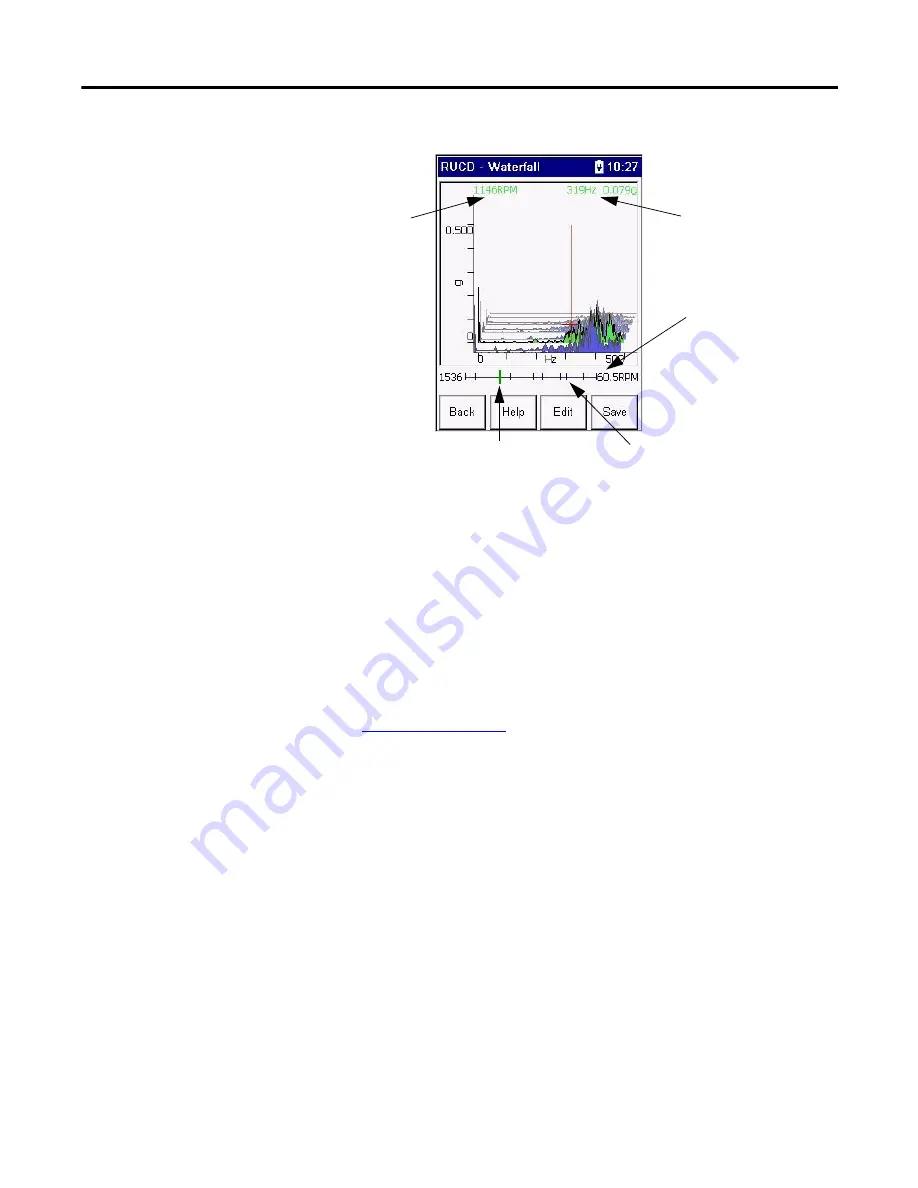
Frequency and
Magnitude at Cursor
Position
Speed, Time, or Data
Collection Number of
Rear Spectrum
Number and Spacing of Spectra
Speed
Active Spectrum

