DT2306 Potentiometer Data Logger Manual
ELM0075B
Page 13
The real-time sensor reading is displayed below the graph window. The pre-set
default range is applied in Range mode. Uncheck 'Auto' to apply a custom range.
Minimum and maximum sensor reading values are automatically adjusted to display
the entire graph. Uncheck 'Auto' to apply custom values. The time range (x-axis) can
be adjusted between 1
– 120 minutes.
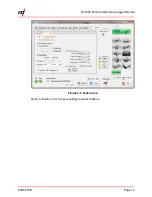
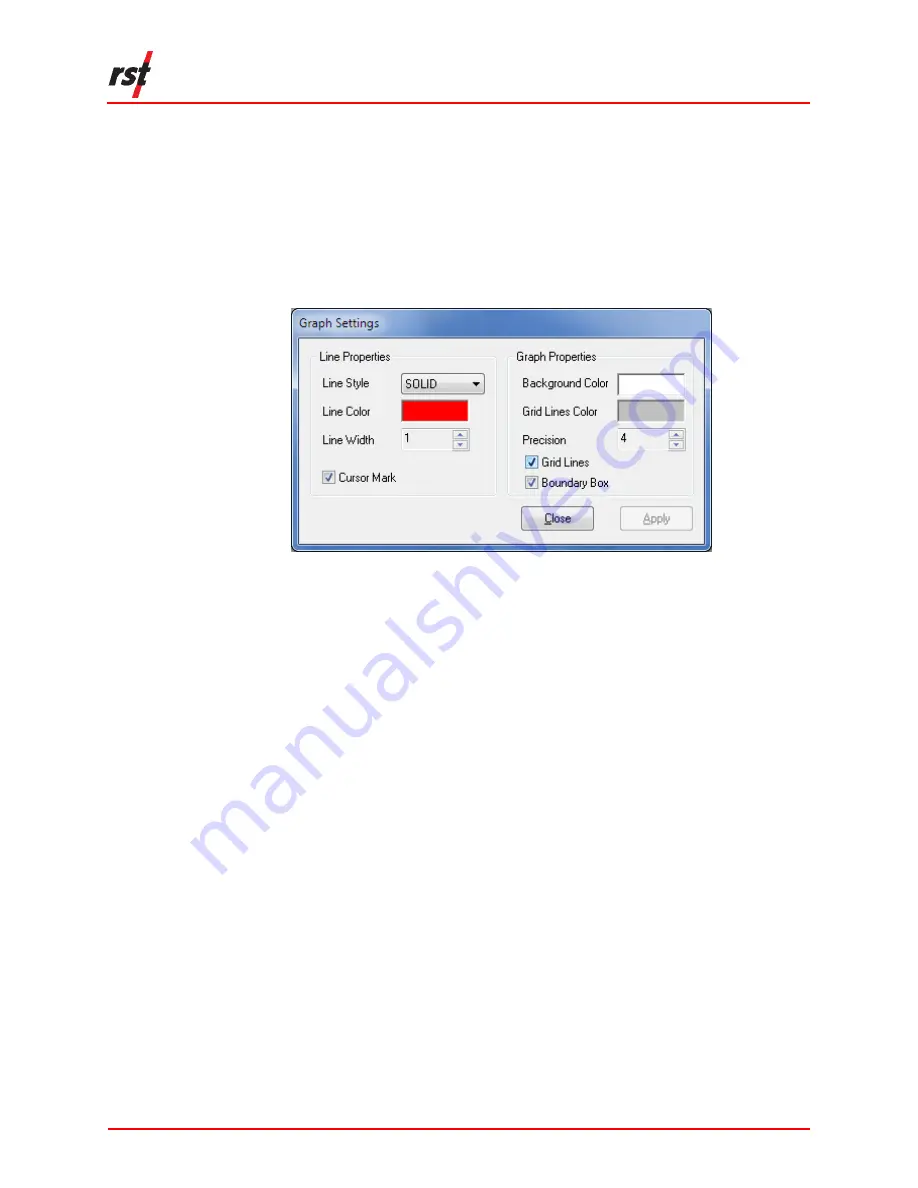
Click the 'Settings' button to open the Graph Settings dialog and manipulate graph
properties such as line style, background color, and grid lines (Figure 4-5).
F
IGURE
4-5
G
RAPHICAL MONITOR OPTIONS
4.5
S
ENSORS
T
AB
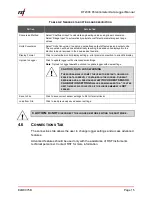
The sensors tab shows current sensor configurations (Figure 4-6). Readings can be
adjusted from % to Engineering Units, if desired. Data required for the conversion to
engineering units is found on the calibration sheet provided by RST with each
shipment. Contact RST if the calibration sheet is missing from the shipment or you
require a replacement.


