Instruction manual V 2.3
44
PWM 230 - PWM 400 - PWM 400/7.5
Instruction manual
9 APPENDIX
9.1 Pressure
loss
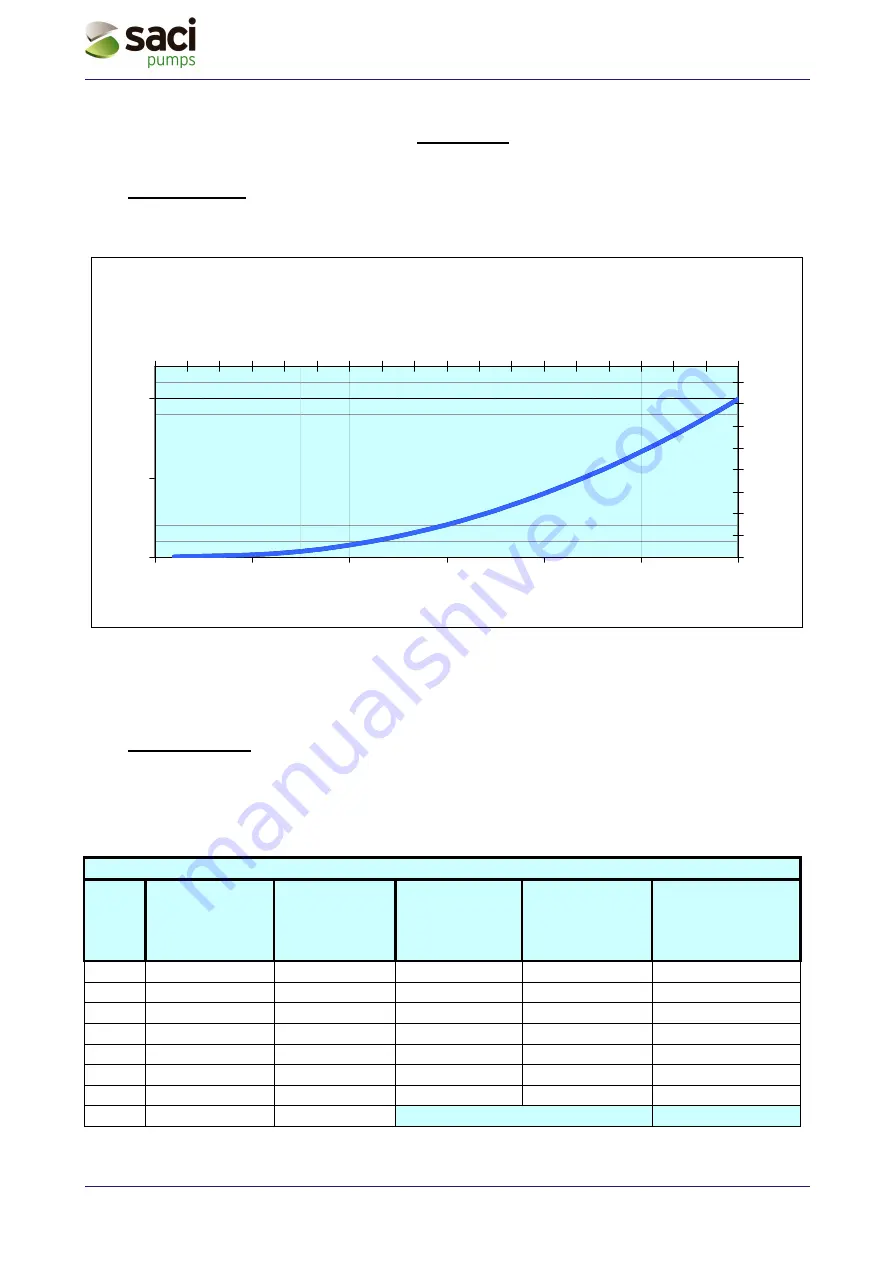
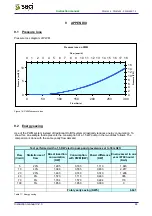
Pressure loss diagram of PWM
Figure 16: PWM’s pressure loss
9.2 Energy
saving
Use of the PWM system instead of traditional On/Off systems drastically reduces energy consumption. To
show this, an example that represents the consumption of a 1,5 kW pump in the two cases follows. The
comparison is done with the same yearly flow demand.
Test performed with a 1,5 KW electro pump and prevalence set to 30 mH2O
Flow
(l/min')
Statistic use of
flow
Direct insertion
consumption
(KW)
Consumption
with PWM (KW)
Power difference
(KW)
Energy saved in one
year (8760 hours)
(Kwh)
5 20% 1,295 0,185 1,110
1.945
10 40%
1,388 0,555
0,833
2.917
20 20%
1,480 0,740
0,740
1.296
40 9%
1,573 1,110 0,463
365
70 6%
1,794 1,570 0,224
118
100 5%
1,850 1,850
0,000
0
Total yearly saving (KWh)
6.641
Table 17: Energy saving
Pressure loss on PWM
0
5
10
0
50
100
150
200
250
300
Flow (l/min)
Pr
essur
e
(m
H2O)
0
2
4
6
8
10
12
14
16
0
1
2
3
4
5
6
7
8
9 10 11 12 13 14 15 16 17 18
Flow (sqm/h)
Pr
essur
e
(PSI)


