52
SALICRU
Entrar
Home
Load
2020-09-15
07:28:06
L1
231. 8
L2
233. 5
L3
232. 8
L1
229. 6
L2
229. 4
L3
230. 1
L1
0. 2%
L2
1. 0%
L3
0. 2%
Tot
0. 2%
Log In
1
2
3
4
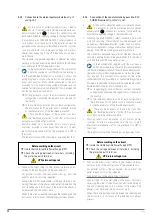
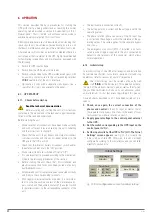
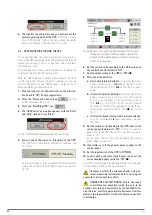
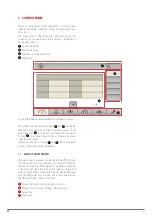
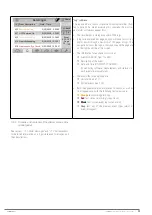
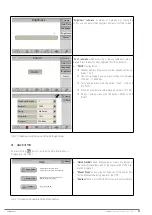
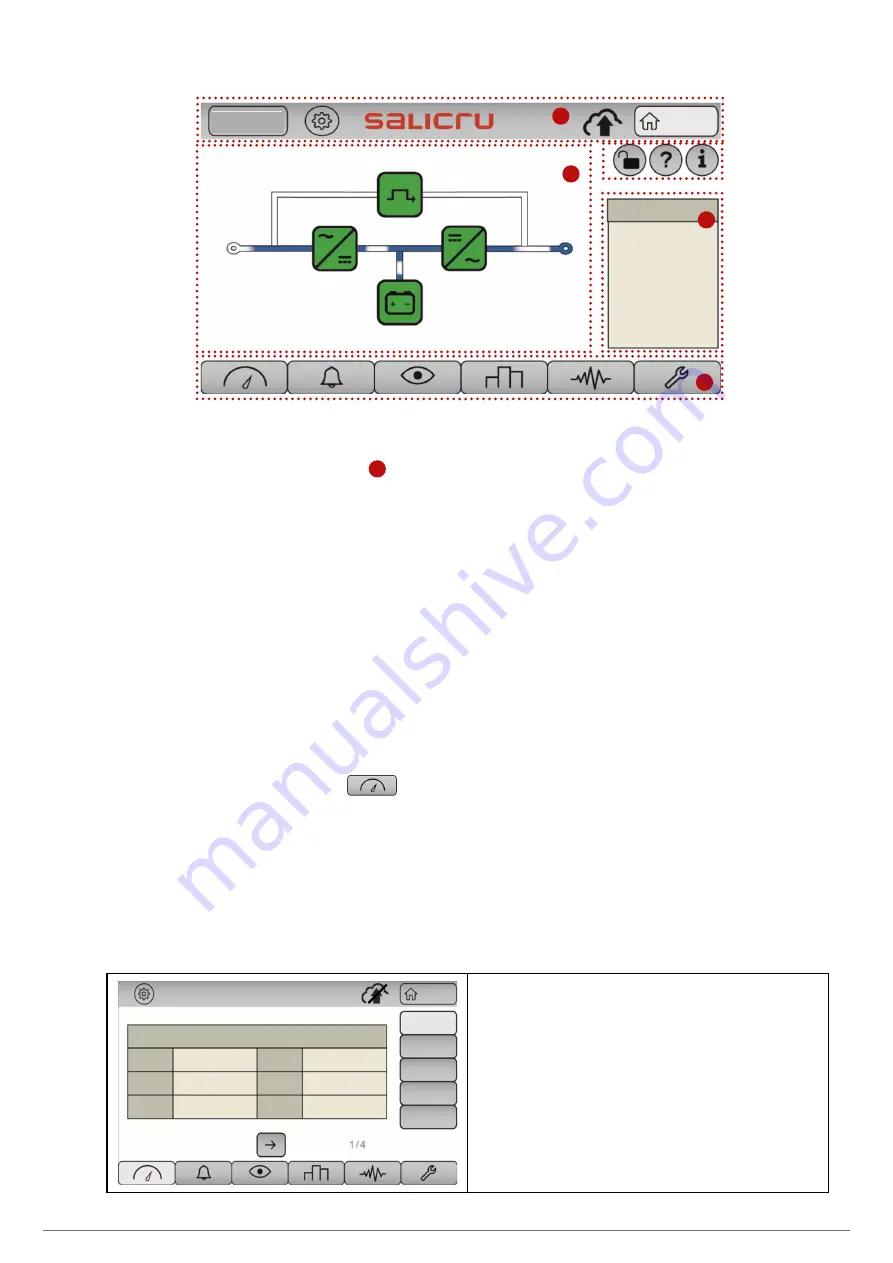
Fig. 68.
Main screen.
Going into detail in the main display area (area
2
), the infor-
mation consists of:
•
Date (YY-MM-DD) and Time (HH:MM:SS).
•
Input voltage measurements per phase (Phase-Neutral).
•
Output voltage measurements per phase (Phase-Neutral).
•
Output load percentage measurements per phase.
•
Total output load percentage measurement.
•
UPS synoptic diagram with the following power blocks rep-
resented:
a.
Static bypass.
b.
Rectifier.
c.
Inverter.
d.
Batteries.
Each power block can be represented with the following colour
code:
GREEN: operating correctly.
ORANGE: operating with an alarm.
RED: critical alarm that prevents operation. Requires
intervention.
A representation of a dynamic power flow (in blue), will detail
the UPS operating mode (normal mode, bypass mode, battery
mode, etc.).
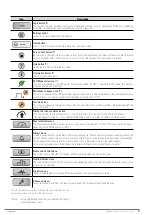
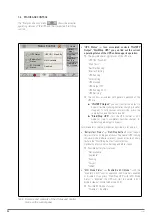
7.2. MEASUREMENTS MENU
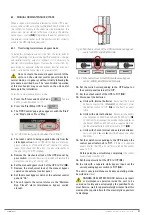
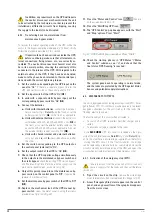
By pressing the Measurements menu icon
, you ac-
cess the set of measurements taken by the unit itself, which
are accessible via the control panel. The measurements are
classified by submenus, which are accessed via the buttons on
the right-hand side. Each submenu can contain more than one
screen, which you can scroll horizontally using the arrows
→
,
←
.
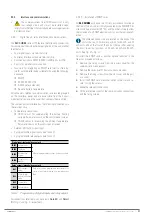
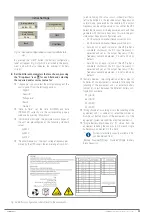
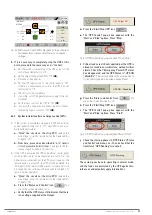
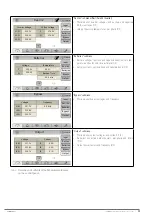
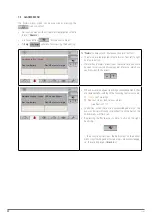
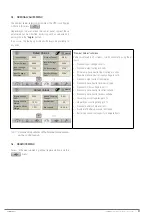
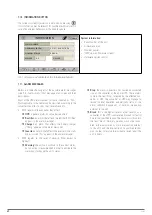
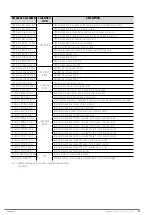
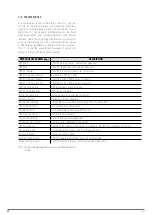
The following table lists all of the available measurements (in-
cluding, as an example, just one screen per submenu).
Home
Input
Rec-Inv
Batteries
Bypass
Output
Voltage
L1-L2
L1-N
L2-N
L3-N
L2-L3
L3-L1
403. 9V
404. 9V
403. 7V
233. 5V
233. 9V
233. 6V
Input
"Input" submenu:
•
Phase-phase and phase-neutral input voltages (1/4).
•
Input currents and Power factors (2/4)
•
Apparent and active input powers, per phase and totals (3/4)
•
Input frequency and input load percentage (4/4).

