EXPLANATION ON DATA TYPES
01.
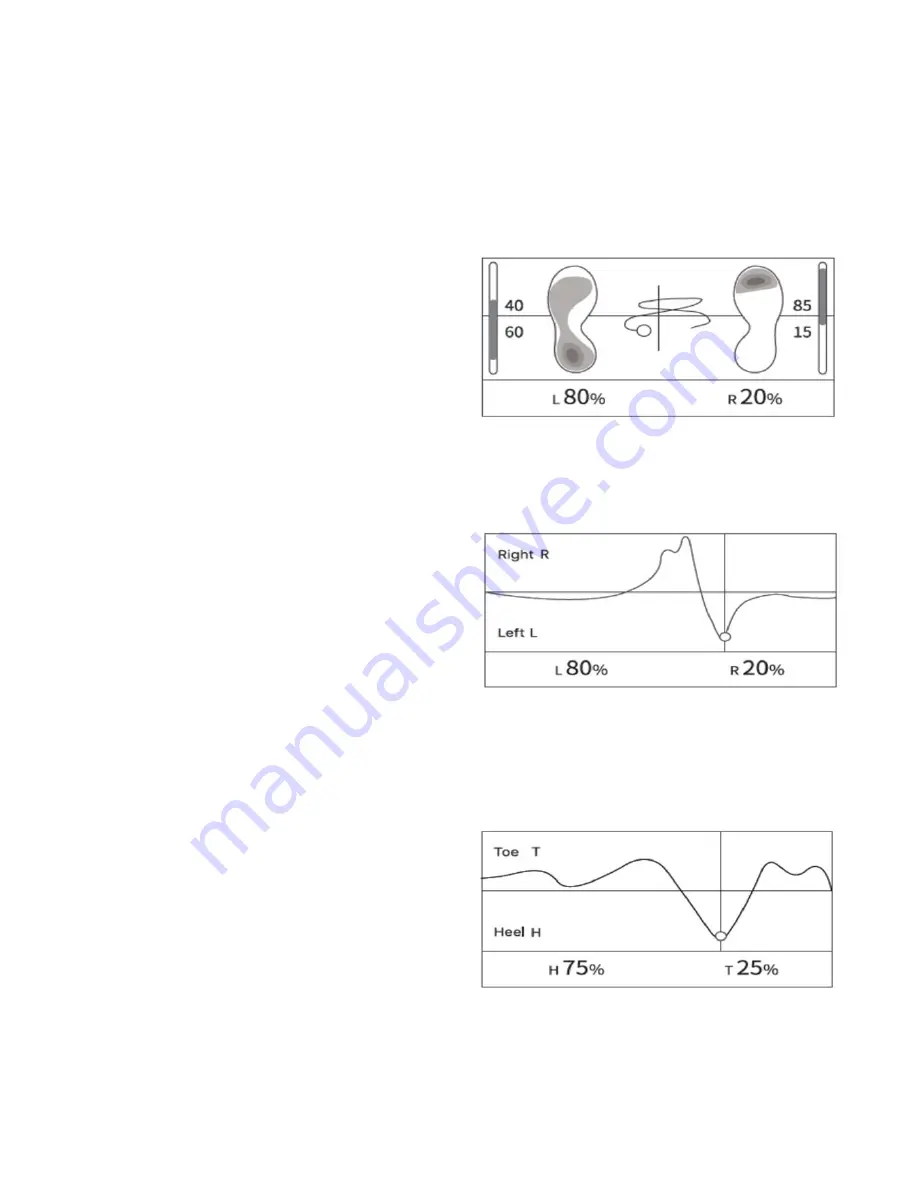
Weight Distribution And Trace
Check how your weight is distributed
on both of your feet. In this diagram,
80% of your overall weight is on the
left side. There is more weight on the
Heel of your left foot and on the toes
of your right foot.
02.
Right / Left Weight Shift Graph
Check your right / left weight shift
pattern on time frame. In this diagram,
there is a clear weight swift from right
to left with 80% of weight on left foot
at the moment.
03.
Heel / Toe Weight Shift Graph
Check your Front / Toe weight shift
pattern on time frame. In this
diagram, there is a clear weight shift
from your toes to your heels with
75% weight on your heels at the
moment.
Summary of Contents for IOFIT
Page 1: ......


