Tel: 886. 909 602 109 Email: sales@salukitec.com
www.salukitec.com
77
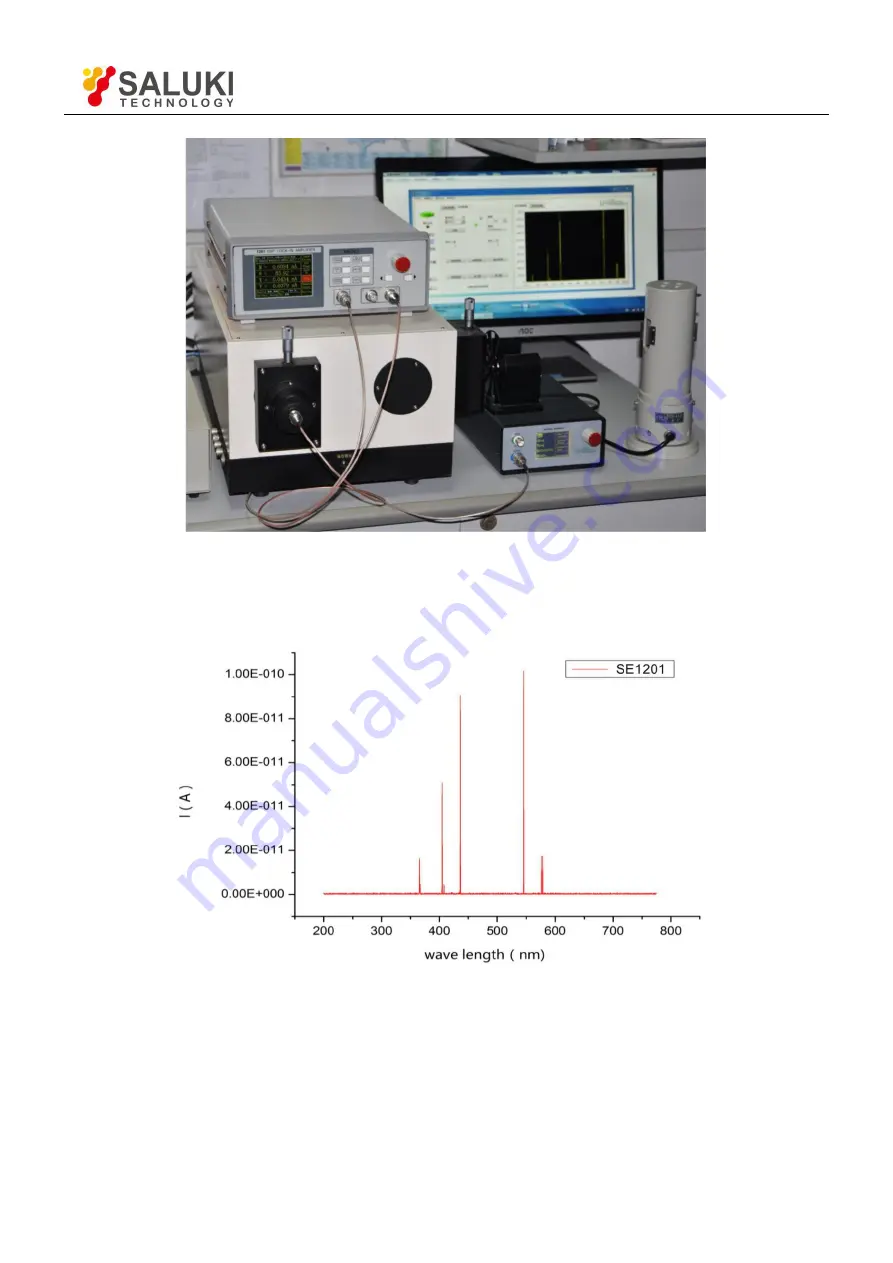
Fig.69 Spectral Measurement Platform Physical Connection
4. Start the spectral measurement and collect data from the data collection platform. Then, you will get an
uncalibrated spectral curve as is shown in Fig.70.
Fig.70 Spectrum Curve measured by SE1201
5. Use the SR830 instead of the SE1201 to measure. Repeat the steps above to run the same experiment. Then you
will get another spectral curve as is shown in Fig.71. You can see that these two curves measured by SE1201 and
SR830 are almost the same.


