2.5
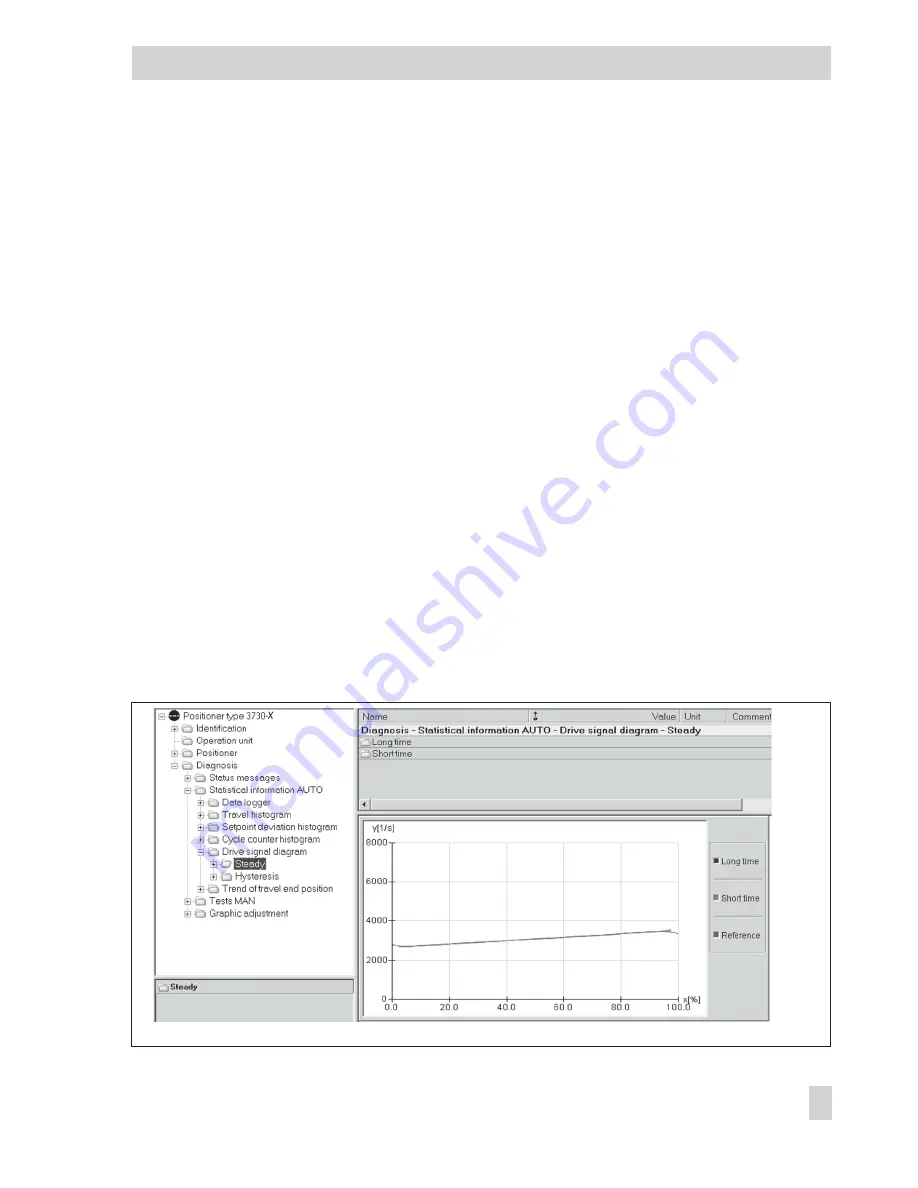
Drive signal diagram
2.5.1 Steady-state drive signal
The signature diagram plotting drive signal
versus valve position is based upon the drive
signal y being the internal control signal of
the i/p converter.
This signal runs linear in relation to the valve
position, similar to the signal pressure in the
pneumatic actuator.
This graph is plotted after initialization and
is stored as a reference in the positioner.
A pressure drop across the valve while the
process is running causes the signal pres-
sure in the actuator to change by the same
amount as the valve travel because the flow
forces have an affect on the equilibrium of
forces at the valve stem.
A similar effect arises when the actuator
springs loose their compression due to one
or more springs failing. As a result, a
change in the correlation between the inter-
nal drive signal y and the valve travel also
pinpoints to one of these events having oc-
curred.
A reduced spring force or a control valve
with the fail-safe position ”Fail-to-close”
leads to the drive signal y shifting down-
wards with an ever smaller gradient.
In contrast, the pressure drop across the
valve while the process is running does
cause the drive signal y to drop, but the
gradient rises irrelevant of the valve travel.
If significant leakage in the pneumatics
arises due to screw fittings that are not tight-
ened properly or due to a tear in the dia-
phragm, the drive signal even starts to rise
steadily at a certain valve opening com-
pared to the reference graph.
The drive signal y starts to rise almost un-
steadily at the restricted valve position if the
positioner supply pressure is insufficient.
The steady-state drive signal diagram con-
tains recent data to allow recent changes to
be recognized. Furthermore, long-term data
are also analyzed to be able to detect prob-
lems due to supply pressure changes or air
EB 8388 EN
15
Statistical information AUTO
Fig. 7 · Steady-state drive signal diagram


