8
EXPERT
+
without TROVIS-VIEW
The EXPERT
+
valve diagnostics are displayed in different ways depending on the type of
communication and the connected engineering tool.
The TROVIS-VIEW software with communication over the SSP interface provides full access
to EXPERT
+
diagnostic functions:
4
Numerical display of parameters
4
Display of parameters in the form of graphs
4
Parameterization, where applicable
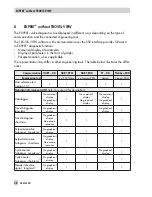
The representation may differ in other engineering tools. The table below illustrates the differ-
ences.
Communication HART – DD
HART-DTM
HART-EDD
FF – DD
Profibus-EDD
Engineering tool
e.g. PACTWare
e.g. Siemens PDM
Various
Siemens PDM
Start reference test
(section 1.5)
•
•
•
•
•
Statistical information AUTO
(refer to section 2 for description)
Data logger
No numerical
display
No graphical
display
•
No numerical
display
No graphical
display
No numerical
display
No graphical
display
•
Travel histogram ·
long-term
1)
No graphical
display
•
•
No graphical
display
•
Travel histogram ·
short-term
No graphical
display
No parame-
terization
•
•
–
•
Setpoint deviation
histogram · long-term
1)
No graphical
display
•
•
–
•
Setpoint deviation
histogram · short-term
No graphical
display
No parame-
terization
•
•
–
•
Cycle counter
histogram · long-term
1)
No graphical
display
•
•
No graphical
display
•
Cycle counter
histogram · short-term
1)
No graphical
display
•
•
–
•
Steady-state drive
signal · long-term
1)
No graphical
display
•
•
–
•
38
EB 8388 EN
EXPERT
+
without TROVIS-VIEW


