User Guide
33
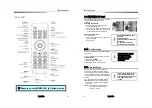
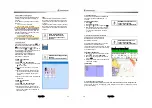
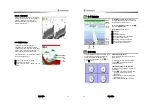
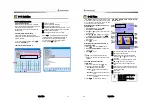
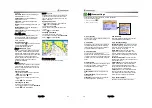
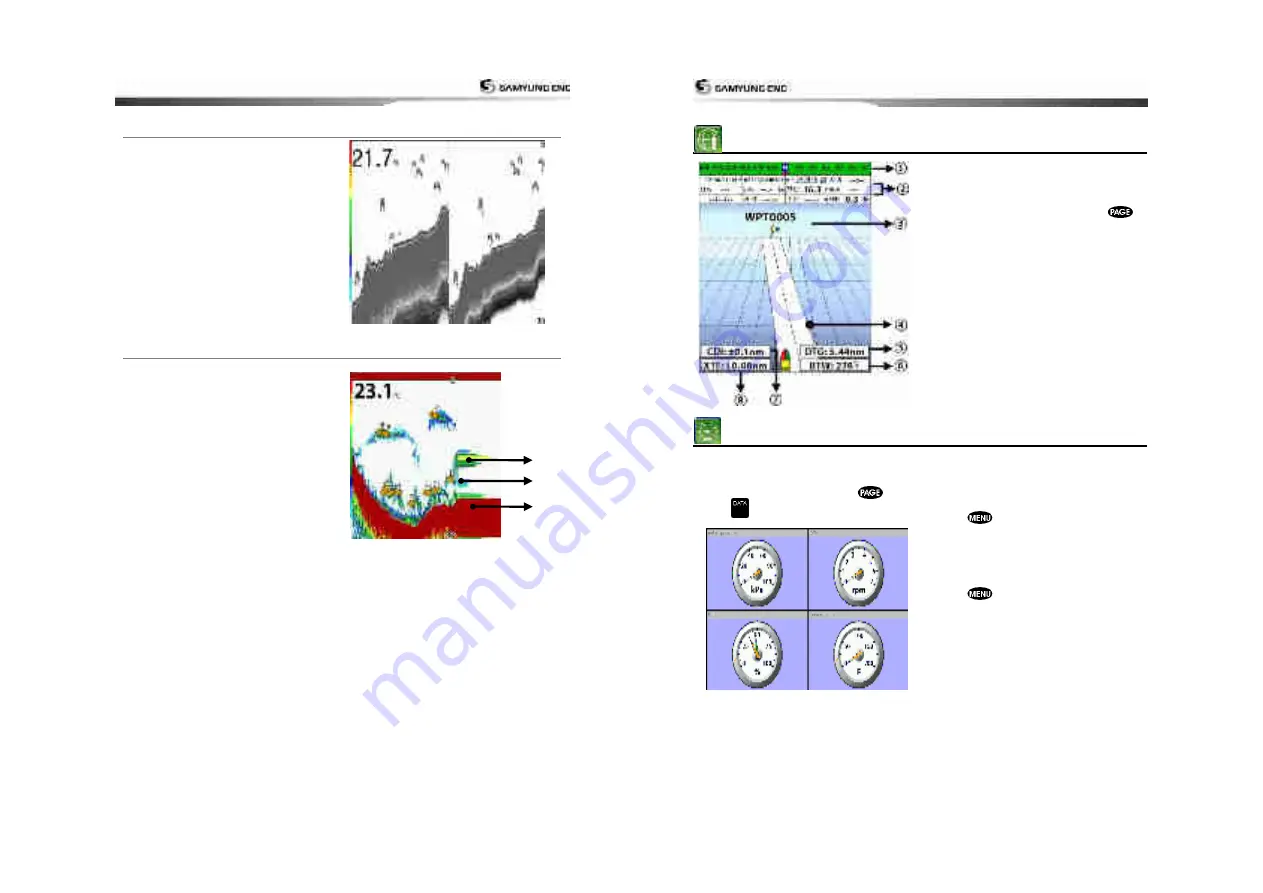
3-6-10 Split 50/200
The 50 kHz display appears on the left and
the 200 kHz appears on the right. This dual
frequency display is very useful for
comparing the same scanning with two
different frequencies.
3-6-11Split A-Scope
This display shows echoes at each
transmission with amplitudes and colors
proportional to their intensities; on the right
of the screen it is useful for estimating the
kind of fish schools and bottom nature.
Echo strength color code varies from weakest
(blue) to strongest (red).
Echoes from fish and the bottom
Unwanted noise echoes.
The strongest echo, usually from the
bottom.
①
③
②
User Guide
34
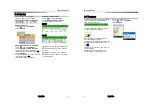
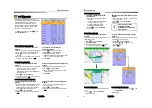
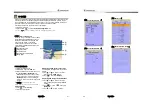
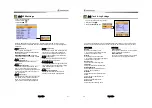
3-7 Highway
The
Highway
window shows a 3D view of
the vessel traveling through the water when
navigating to a destination point.
To go to the
Highway
window, press
and select
Highway
icon.
The
Highway
window shows
:
ཛ
Compass.
ཛྷ
Data bar.
ཝ
Destination waypoint.
ཞ
Boat’s plotted course to destination
.
ཟ
DTG scale (Distance To Go).
འ
BTW scale (Bearing to waypoint).
ཡ
CDI (Course Deviation Indicator).
ར
XTE scale (Cross Track Error).
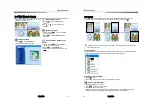
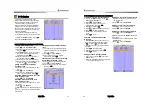
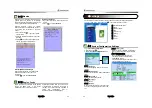
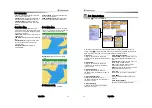
3-8 Data
The Data window displays all the information
you need during navigation such as water,
engine, fuel related information, etc.
To select the data window, press
or
press icon.
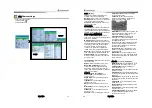
Selecting a data layout
The data window can show one of seven
gauge layouts.
To select a layout from the data window:
1 Press
and select data
Layout.
2 Select one layout.
Changing a gauge in one selected
To change a gauge displayed in a layout in
Data display.
1 Press
and select Data Setup then
the upper left side gauge will be
highlighted.
2 Select a gauge you want to change and
select Gauge type.
3 Select a data type you want to display.
Summary of Contents for N5100
Page 1: ...User Guide 1 User Guide 2...
Page 33: ...User Guide 65 User Guide 66...


